Fig. 1
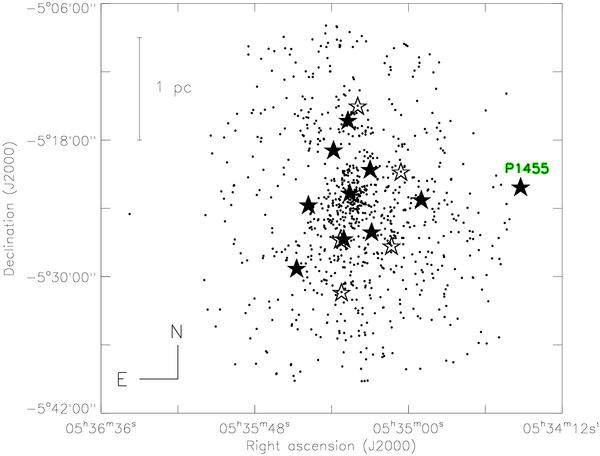
Spatial distribution of our ONC targets (filled stars) and the sample of D’Orazi et al. (2009) re-analyzed in this work (empty stars). Dots represent the Hillenbrand (1997) sample with membership probability higher than 90%. The field is centered on the Trapezium cluster and covers an area of about 0.5° × 0.5°. The position of the star at the edge of the main cluster (P1455) is given.
Current usage metrics show cumulative count of Article Views (full-text article views including HTML views, PDF and ePub downloads, according to the available data) and Abstracts Views on Vision4Press platform.
Data correspond to usage on the plateform after 2015. The current usage metrics is available 48-96 hours after online publication and is updated daily on week days.
Initial download of the metrics may take a while.