Fig. 1
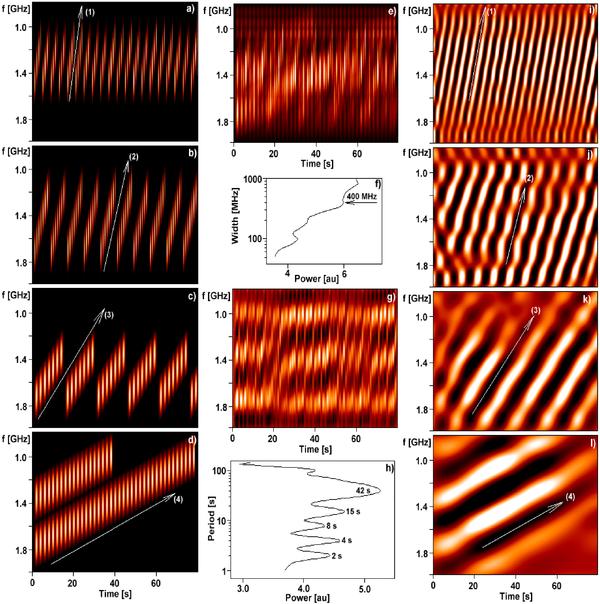
Test of separation of bursts (artificial dynamic spectrum, duration = 80 s, frequency range = 0.8−2.0 GHz). Four different artificial DPSs are shown in the panels a − d), for their parameters see Table 1. The sum of these DPSs plus four other pulsations (Table 1) is shown in panel e). Panel f) shows the averaged global wavelet spectrum (ASf) with a peak for the frequency width = 400 MHz, panel g) the filtered spectrum ASf in the frequency width range 220−500 MHz, and panel h) the averaged global wavelet spectrum (ASt) made from the spectrum in panel g) with peaks for the temporal periods P = 2, 4, 8, 15 and 42 s. The panels i − l) show the final separated spectra: i) separated pulsations in the P-range 2.9−5.7 s, j) separated pulsations in the P-range 5.7−10.0 s, k) separated pulsations in the P-range 10−24 s, and l) separated pulsations in the P-range 24−90 s. The positive and negative parts of amplitudes (in relation to their mean values) are in white and black, respectively (panels g) and i − l)). The arrows show the frequency drifts D (Table 1).
Current usage metrics show cumulative count of Article Views (full-text article views including HTML views, PDF and ePub downloads, according to the available data) and Abstracts Views on Vision4Press platform.
Data correspond to usage on the plateform after 2015. The current usage metrics is available 48-96 hours after online publication and is updated daily on week days.
Initial download of the metrics may take a while.