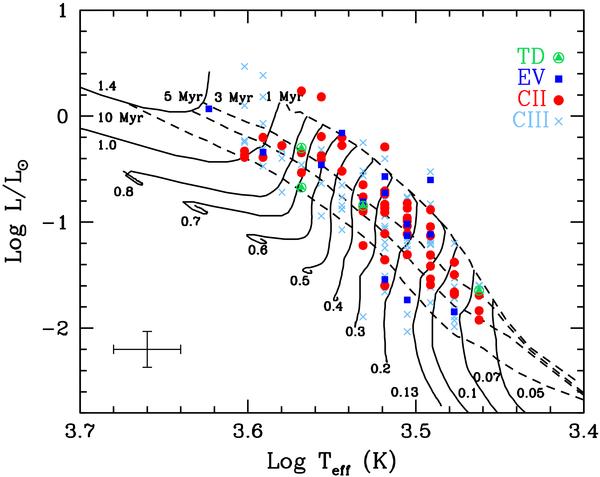
Fig. 3

Location of the observed objects (class III, class II, and objects with “non-classical” disks, as labeled) on the HR diagram. Evolutionary tracks and isochrones are taken from Baraffe et al. (1998). Stellar masses and ages are labeled. The horizontal bar refers to the error on the effective temperature, the vertical bar reflects the error of the bolometric correction of the ZAMS stars related to the error on the effective temperatures.
Current usage metrics show cumulative count of Article Views (full-text article views including HTML views, PDF and ePub downloads, according to the available data) and Abstracts Views on Vision4Press platform.
Data correspond to usage on the plateform after 2015. The current usage metrics is available 48-96 hours after online publication and is updated daily on week days.
Initial download of the metrics may take a while.


