Fig. B.1
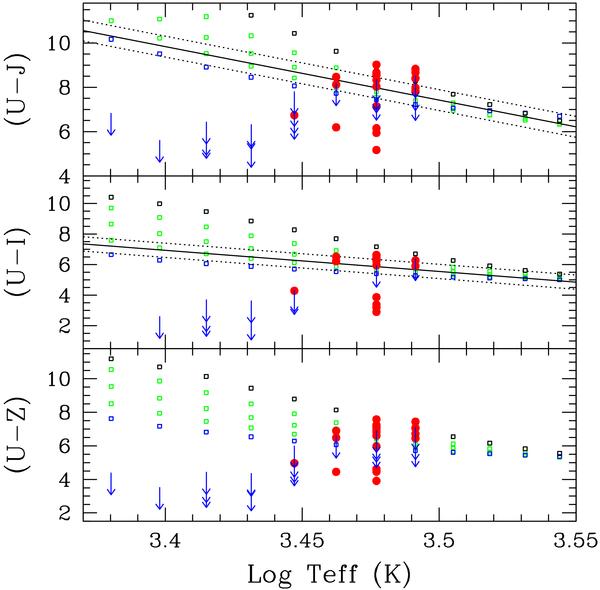
U-λ colors as function of Teff. The red circles are objects with measured U-band fluxes, arrows are objects with U-band upper limits. The squares are model-predicted colors for different gravity, from 5.5 (black squares, top) to 3.5 (blue squares, lowest). The solid lines show the best-fit relations for Class III derived in Sect. 4.1, extrapolated to lower Teff; dashed lines are ± 2σ. We will consider as accretors objects with colors below the photospheric strip: five BDs have clear evidence of U-band excess (note that for two we only have two colors), one only marginal evidence (from (U − I) and (U − J), while (U − Z) is photospheric). Hereafter we mark the upper limit as dashes for clarity. (A color version of this figure is available in the online journal.)
Current usage metrics show cumulative count of Article Views (full-text article views including HTML views, PDF and ePub downloads, according to the available data) and Abstracts Views on Vision4Press platform.
Data correspond to usage on the plateform after 2015. The current usage metrics is available 48-96 hours after online publication and is updated daily on week days.
Initial download of the metrics may take a while.