Fig. 12
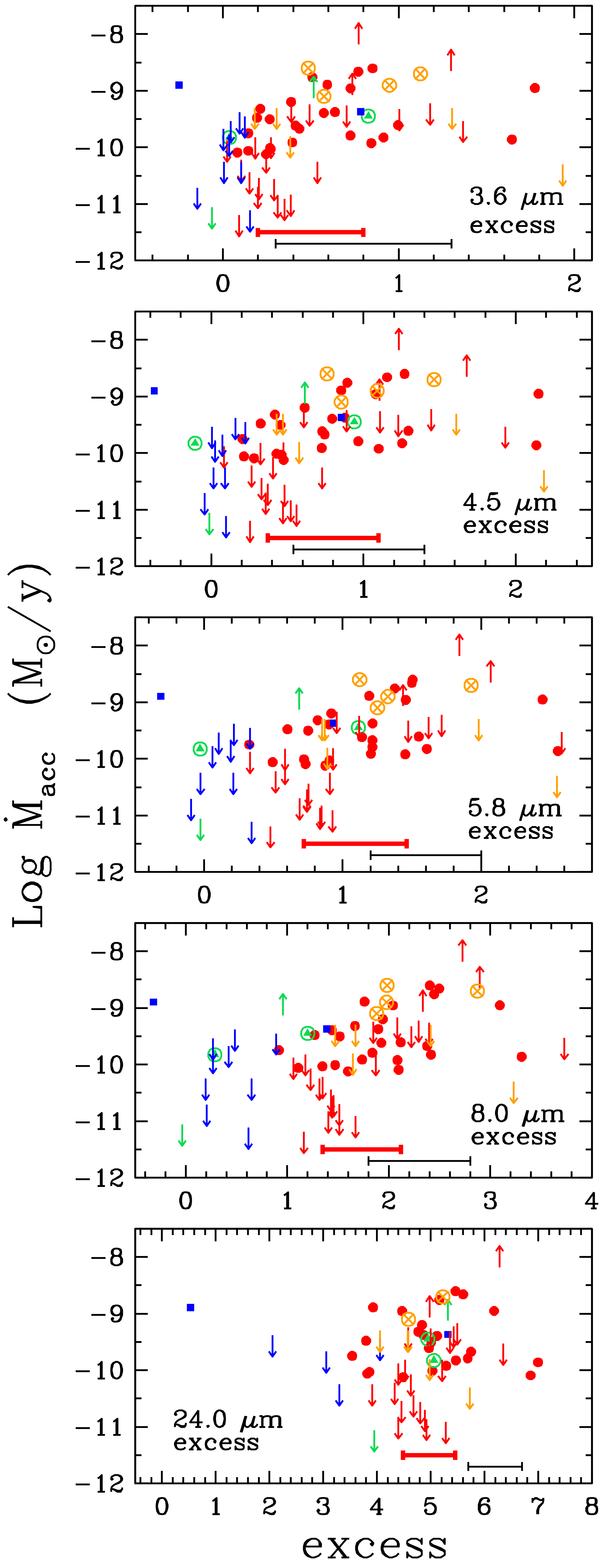
Ṁacc vs. excess emission (in mag) in the four IRAC Spitzer bands and for the 24 μm MIPS band. The median excess emission and first quartiles are shown in each panel by the red (thick) horizontal lines; for comparison, we also plot the median Taurus class II SED (black (thin) line; D’Alessio et al. 2006). Symbols as in Fig. 7. (A color version of this figure is available in the online journal.)
Current usage metrics show cumulative count of Article Views (full-text article views including HTML views, PDF and ePub downloads, according to the available data) and Abstracts Views on Vision4Press platform.
Data correspond to usage on the plateform after 2015. The current usage metrics is available 48-96 hours after online publication and is updated daily on week days.
Initial download of the metrics may take a while.