Fig. 11
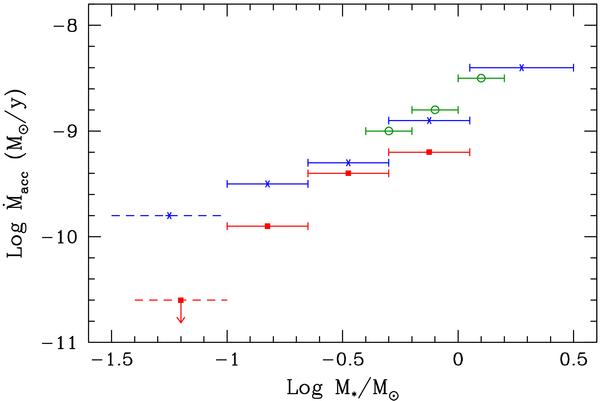
Median values of Ṁacc as function of M∗. Red lines (with a central square) refer to σ Ori Class II and TD disks; the lowest mass bin should be considered as an upper limit only (see text). Blue lines (crosses) show the distribution for ρ-Oph (data from Natta et al. 2006, see Appendix A); green lines (circles) for Tr 37 (data from Sicilia-Aguilar et al. 2010). (A color version of this figure is available in the online journal.)
Current usage metrics show cumulative count of Article Views (full-text article views including HTML views, PDF and ePub downloads, according to the available data) and Abstracts Views on Vision4Press platform.
Data correspond to usage on the plateform after 2015. The current usage metrics is available 48-96 hours after online publication and is updated daily on week days.
Initial download of the metrics may take a while.