Fig. 5
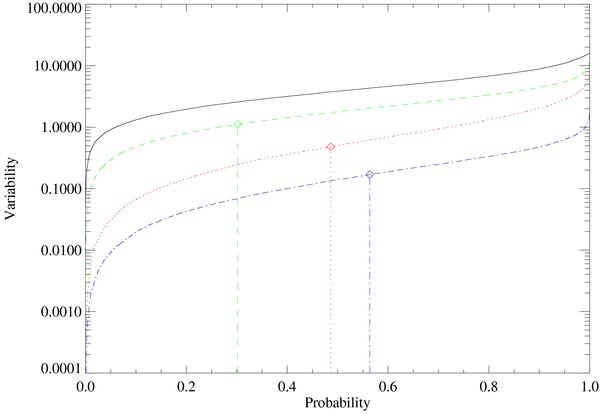
Simulated cumulative distributions (10 000 trials) of the variability index V versus fraction of trials, or probability. Solid black: mean flux 131 × 10-8 photons cm-2 s-1 and square root of variance 33.8 × 10⁻⁸ photons cm-2 s-1 for E ≥ 100 MeV; dotted red: mean flux 60 × 10-8 photons cm-2 s-1 and square root of variance 15.5 × 10⁻⁸ photons cm-2 s-1 for E ≥ 100 MeV; dashed green: mean flux 33 × 10-8 photons cm-2 s-1 and square root of variance 8.5 × 10⁻⁸ photons cm-2 s-1 for E ≥ 400 MeV; dot-dahsed blue: mean flux 17 × 10-8 photons cm-2 s-1 and square root of variance 4.4 × 10⁻⁸ photons cm-2 s-1 for E ≥ 400 MeV. The vertical lines indicate the observed values of V and the associated probability for the corresponding dataset (Table 2).
Current usage metrics show cumulative count of Article Views (full-text article views including HTML views, PDF and ePub downloads, according to the available data) and Abstracts Views on Vision4Press platform.
Data correspond to usage on the plateform after 2015. The current usage metrics is available 48-96 hours after online publication and is updated daily on week days.
Initial download of the metrics may take a while.