Free Access
Fig. 1
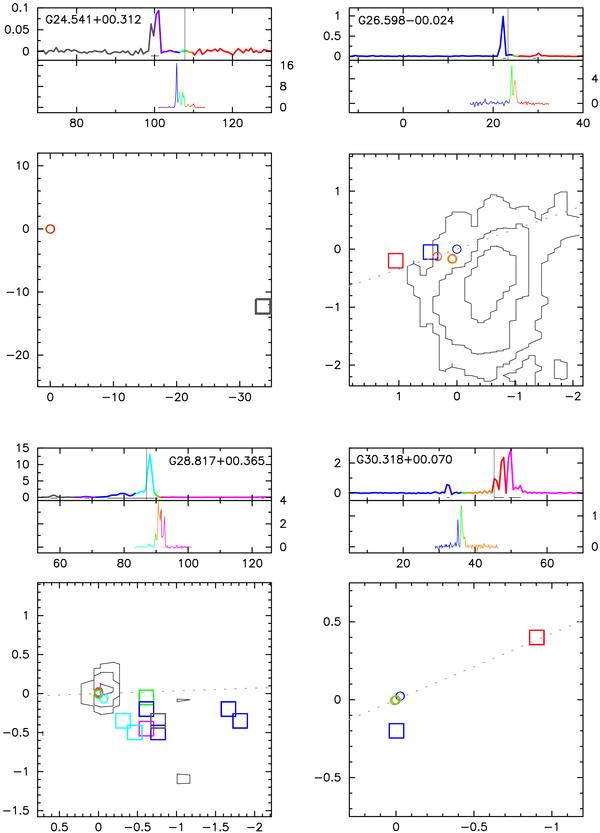
continued. The radio continuum emission at the levels of 3, 10 and 30 × σrms detected towards G26.598−00.024 and G28.817+00.365 are indicated by black contour lines (Bartkiewicz et al. 2009).
Current usage metrics show cumulative count of Article Views (full-text article views including HTML views, PDF and ePub downloads, according to the available data) and Abstracts Views on Vision4Press platform.
Data correspond to usage on the plateform after 2015. The current usage metrics is available 48-96 hours after online publication and is updated daily on week days.
Initial download of the metrics may take a while.