Free Access
Fig. 4
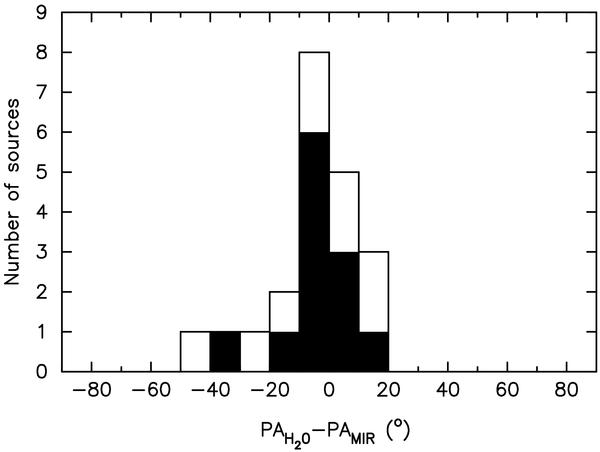
Histogram of the differences in the position angles of major axes of water maser distribution and 4.5 μm emission excess for the studied objects. The sources with small errors in PAMIR are indicated by the solid histogram.
Current usage metrics show cumulative count of Article Views (full-text article views including HTML views, PDF and ePub downloads, according to the available data) and Abstracts Views on Vision4Press platform.
Data correspond to usage on the plateform after 2015. The current usage metrics is available 48-96 hours after online publication and is updated daily on week days.
Initial download of the metrics may take a while.