Fig. 4
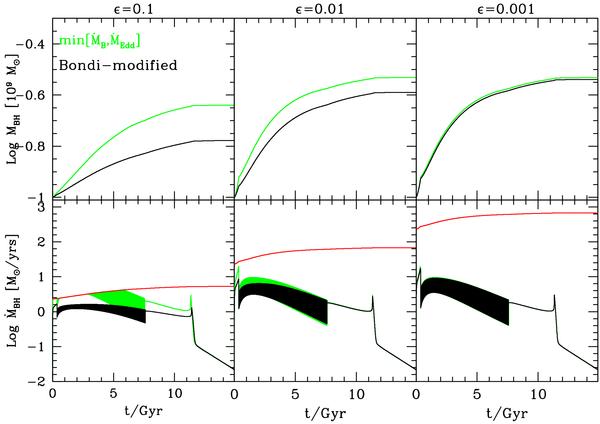
Evolution of the SMBH mass and accretion rate computed according to Eqs. (25) (green line, SOCS) and (30) (black line) for a model with Minf = 1.25 × 10¹⁰ M⊙, Mh = 5 × 10¹⁰ M⊙, and initial SMBH mass of 108 M⊙. From left to right: ϵ = 0.1, ϵ = 0.01, and ϵ = 0.001. The red line represents the Eddington limit for the SOCS model.
Current usage metrics show cumulative count of Article Views (full-text article views including HTML views, PDF and ePub downloads, according to the available data) and Abstracts Views on Vision4Press platform.
Data correspond to usage on the plateform after 2015. The current usage metrics is available 48-96 hours after online publication and is updated daily on week days.
Initial download of the metrics may take a while.