Fig. 5
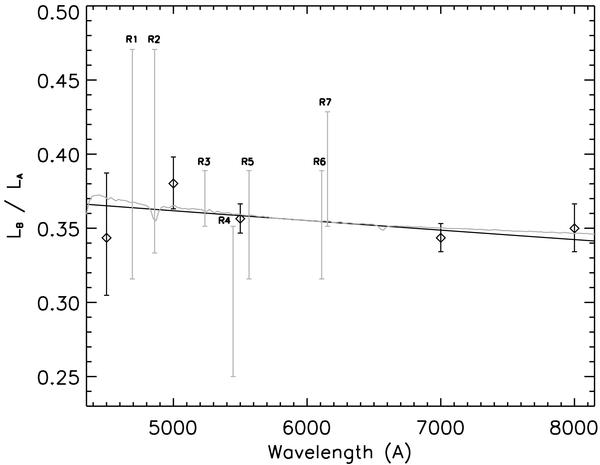
Determination of the light contributions of θ2 Tau AB, using the disentangled component spectra. The grey vertical bars represent the acceptable values for ℓB/ℓA, for each spectral region (Table 1). The ℓB/ℓA predicted by AM06 are also shown (i.e. black diamonds with error bars), as well as Eq. (2) (straight black line). The grey line represents the slope of the flux ratio curve of two synthetic spectra with a difference of temperature corresponding to +200 K, in the sense (component B – component A). See Sects. 3 and 4.1.
Current usage metrics show cumulative count of Article Views (full-text article views including HTML views, PDF and ePub downloads, according to the available data) and Abstracts Views on Vision4Press platform.
Data correspond to usage on the plateform after 2015. The current usage metrics is available 48-96 hours after online publication and is updated daily on week days.
Initial download of the metrics may take a while.