| Issue |
A&A
Volume 525, January 2011
|
|
|---|---|---|
| Article Number | A119 | |
| Number of page(s) | 13 | |
| Section | Astrophysical processes | |
| DOI | https://doi.org/10.1051/0004-6361/201015136 | |
| Published online | 07 December 2010 | |
Star formation in extreme environments: the effects of cosmic rays and mechanical heating
1
Leiden Observatory, Leiden University,
PO Box 9513,
2300 RA
Leiden,
The Netherlands
e-mail: This email address is being protected from spambots. You need JavaScript enabled to view it.
2
Kapteyn Astronomical Institute, PO Box 800, 9700 AV
Groningen, The
Netherlands
e-mail: This email address is being protected from spambots. You need JavaScript enabled to view it.
Received:
2
June
2010
Accepted:
10
October
2010
Abstract
Context. The molecular interstellar medium in extreme environments, such as Arp 220, but also NGC 253 appears to have extremely high cosmic ray (CR) rates (103−104 × Milky Way) and substantial mechanical heating from supernova driven turbulence.
Aims. We explore the consequences of high CR rates and mechanical heating on the chemistry of the clouds.
Methods. PDR model predictions are made for low, n = 103, and high, n = 105.5 cm-3, density clouds using well-tested chemistry and radiation transfer codes. Column densities of relevant species are discussed, and special attention is given to water-related species. Fluxes are shown for fine-structure lines of O, C+, C, and N+, and molecular lines of CO, HCN, HNC, and HCO+. A comparison is made with an X-ray dominated region model.
Results. Fine-structure lines of [CII], [CI], and [OI] are remarkably similar for different mechanical heating and CR rates, when already exposed to large amounts of UV. Both HCN and H2O abundances are boosted for very high mechanical heating rates, while ionized species are relatively unaffected. Both OH+ and H2O+ are enhanced for very high CR rates ζ ≥ 5 × 10-14 s-1. A combination of OH+, OH, H2O+, H2O, and H3O+ traces the CR rates, and is able to distinguish between enhanced cosmic rays and X-rays.
Key words: cosmic rays / galaxies: ISM / galaxies: active / galaxies: starburst / ISM: molecules
© ESO, 2010
1. Introduction
Observations of molecular tracers imply that both star formation and an active galactic nucleus (AGN, an accreting supermassive black hole) can drive the physics and chemistry of the central ~kpc of active galaxies (Sanders & Mirabel 1996; Gao et al. 1997; Gao & Solomon 1999; Baan et al. 2008; van der Werf et al. 2010). In particular, ultra-luminous infrared galaxies (ULIRGs), with infrared (8−1000 μm) luminosities LIR ≥ 1012 L⊙, appear to contain large reservoirs of dense, n > 104 cm-3, gas. This gas provides the fuel for (intense) star formation and black hole accretion.
The irradiation by UV photons (6–13.6 eV; creating so-called photon-dominated regions, or PDRs, e.g., Hollenbach & Tielens 1999) from a starburst or by X-rays (1–100 keV, creating so-called X-ray dominated regions, or XDRs, e.g., Lepp & Dalgarno 1996; Maloney et al. 1996) from an AGN is expected to produce different signatures in the molecular chemistry (Meijerink & Spaans 2005; Meijerink et al. 2006, 2007). Mechanical heating due to supernova and stellar outflow driven turbulence has also been explored (Loenen et al. 2008), which shows that warm molecular gas may persist beyond a few magnitudes of extinction in molecular clouds. Furthermore, the radiation feedback from ultraviolet photons, resulting in warm dust of more than 50 K, affect the thermodynamics of the molecular gas, possibly resulting in a top-heavy initial mass function (IMF; Klessen et al. 2007; Hocuk & Spaans 2010).
The analysis of the physical state of this irradiated gas allows one to constrain the evolutionary state of, ambient star formation rate in, and the importance of feedback for ULIRGs (Baan et al. 2010). In this work, we focus on the feedback caused by massive stars. In particular, we consider the UV emission from hot stars, the (elevated) production of cosmic rays from the resulting supernova remnants, and the heating produced by turbulent motions driven by travelling supernova blast waves.
A very nice case in point for the feedback effects mentioned above is Arp 220, the proto-typical ULIRG at 77 Mpc, which boasts an infrared luminosity of LIR = 1.3 × 10¹² L⊙ (Soifer et al. 1987). Arp 220 is a merger that contains two nuclei separated by about 370 pc in the east-west direction (e.g., Rodríguez-Rico et al. 2005) and has a nuclear star formation rate of 50–100 M⊙ yr-1 (Smith et al. 1998).
Observations of Arp 220 at a resolution of 0.3″ (100 pc) by Sakamoto et al. (2009) indicate P Cygni type profiles in HCO+ 4–3, 3–2 and CO 3–2. These authors interpret their results as a ~100 km s-1 outflow driven by supernova explosions (or radiation pressure from the starburst). As many as 49 supernova remnants (SNRs) have been detected with VLBI (1 pc resolution) at 18 cm (Lonsdale et al. 2006), confirming the formation and demise of many massive stars. The latter authors derive a supernova rate of 3 yr-1 for the western nucleus and 1 yr-1 for the eastern nucleus, more than two orders of magnitude larger than the entire Milky Way.
Limits on the cosmic ray (CR) rate in our Milky Way are discussed by, e.g., van der Tak & van Dishoeck (2000). They found a value of ζ = 2.6 ± 0.8 × 10⁻¹⁷ s-1 with upper limits that are 3 to 5 times higher. In this paper, we adopt ζ = 5 × 10-17 s-1 as the canonical Milky Way value. Highly elevated cosmic ray rates are seen in gamma-ray observations of the starburst galaxy NGC 253 (Acero et al. 2009) performed with the High Energy Stereoscopic System (HESS) array. The observed gamma-ray flux indicates a cosmic ray density that is three orders of magnitude higher than that of our Milky Way.
Papadopoulos (2010) suggests that ULIRGs generally have cosmic ray densities UCR ~ 103−104UCR,MW, and discusses the impact on the ionization fraction and thermal state of the gas, and the consequences for the initial conditions of star formation. In this paper, we first discuss the detailed effects of enhanced cosmic-ray rates on both the thermal balance and chemistry (Sect. 2). Then, we highlight the global consequences on the chemistry and suggest potential diagnostic species (Sect. 3), which is followed by the observational consequences (Sect. 4). In Sect. 5, we conclude with the key diagnostics needed to derive quantitative and qualitative properties of interstellar medium (ISM) exposed to large amounts of cosmic rays, and show how it differs from those of gas exposed to X-rays.
Model parameters.
2. PDR models
We constructed a set of PDR models (see Table 1) from the code described by Meijerink & Spaans (2005) and Meijerink et al. (2007). We consider a low (n = 103 cm-3) and a high density (n = 105.5 cm-3) phase. The low density phase of the ISM is generally not directly connected to star formation. Therefore, the adopted incident UV field in the low density models (G0 = 103) is chosen to be a factor of 100 less intense than the high density phase (G0 = 105) to reflect this and essentially corresponding to models 1 and 4 in Meijerink & Spaans (2005). We varied the incident cosmic-ray rates between ζ = 5 × 10-17 s-1 and ζ = 5 × 10-13 s-1. The highest cosmic-ray rate considered here is two orders of magnitude higher than in Meijerink et al. (2006). We adopt a solar metallicity Z = Z⊙ and an abundance ratio [C]/[O] = 0.4, which is based on the average abundances of Asplund et al. (2005) and Jenkins (2004), and summarized in Table 2 of Meijerink & Spaans (2005) with an updated S depletion (Loenen 2009).
We also consider the effect of mechanical heating in the high density case, specifically Γmech = 3.0 × 10⁻¹⁸ and 2.0 × 10⁻¹⁷ erg cm-3 s-1, which correspond to star formation rates of about SFR = 140 and 950 M⊙ yr-1, respectively, for a Salpeter IMF (see Loenen et al. 2008, for details). Mechanical heating is only considered in the high density case, n = 105.5 cm-3, since we expect this dense phase to be directly responsible for star formation and thus be affected directly by the supernovae from massive stars. We assume that the low density phase is only affected by cosmic rays. These are able to travel through large columns (NH ~ 1024 cm-2), since they have small absorption cross-sections, and are likely to impact the ISM on larger scales.
The effects on the thermal balance and chemistry are discussed for model sets 1a (G0 = 105; n = 105.5 cm-3), 1b and 1c (same as model set 1a, with Γmech = 3.0 × 10⁻¹⁸ and 2.0 × 10⁻¹⁷ erg cm-3 s-1, respectively), and 2 (G0 = 103; n = 103 cm-3) to highlight the differences between the high and low density phases of the ISM.
2.1. Thermal balance
Without boosting the CR rate (i.e. ζ = 5 × 10-17 s), the surface temperature obtained in the high density model is higher than that of the low density model. This may seem a little counterintuitive, since G0/n = 1 (0.3) for the low (high) density model, and as a result there is more energy available per particle in the low density model. In addition, cooling is more efficient at high densities. However, for intense radiation fields (G0 > 104, and n > 104−105 cm-3), the gas cooling thermalizes (Λ ∝ n instead of n2), while photo-electric heating becomes more effective because of the higher electron density, and more effective than Γ ~ n (e.g., Kaufman et al. 1999; Meijerink et al. 2007).
The sensitivity of the thermal balance to cosmic rays is different for the high and low density phases (see Fig. 1). In model set 1a, only very high CR rates (ζ ≥ 5 × 10-14 s-1) are able to increase the temperature significantly (~25 to 200 percent) in both the radical region (low AV) as well as the shielded molecular region. In model sets 1b and 1c, mechanical heating in the shielded region of the cloud dominates over cosmic ray heating. Here, the temperatures overlap for all cosmic ray rates, reaching values T ~ 100−200 K for model set 1b and T ~ 400 K for model set 1c. Hence even for moderate mechanical heating rates (in this case corresponding to a SFR = 140 M⊙/yr), the CR rate has no additional effect on the thermal balance in the shielded regions of clouds. In Model set 2, temperatures increase for higher CR rates at all column densities, by an order of magnitude at the highest adopted CR rate. The effect on the thermal balance is larger because cooling is simply less efficient at lower densities (Λ ∝ n2) than the heating rate, which is proportional to the density (Γ ∝ n). This ensures that the low density models are more sensitive to a higher heating rate. This is enhanced by the fractional electron abundance also being able to be increased more easily at lower densities (krec ∝ n2), resulting in a higher heating efficiency (cf., Bakes & Tielens 1994), and higher heating rates.
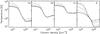 |
Fig. 1 Temperatures for all models sets (see Table 1) for cosmic ray rates ζ = 5 × 10-17 (solid line), 5 × 10-16 (dotted), 5 × 10-15 (dashed), 5 × 10-14 (dot-dashed), and 5 × 10-13 s-1 (dotted-dashed). |
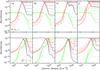 |
Fig. 2 Abundances of H, H2, e−, C+, C and CO for all models sets (see Table 1). Line styles corresponding to the different CR rates are the same as in Fig. 1. |
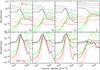 |
Fig. 3 Abundances of H+, |
2.2. Chemical balance
Electron abundances (Fig. 2): the effect of cosmic rays is less apparent in the unshielded region (NH ≲ 3 × 1021 cm-2) than in the molecular region (NH ≳ 1022 cm-2) of the cloud, since charged species in the unattenuated part of cloud are also produced by means of the photoionization by the stellar radiation field. Here, the fractional abundance (which is defined as xi = ni/n(H + 2H2) of electrons varies across the range of xe ~ 10-4−10-3 (10-4−10-2) in the high (low) density models, while the CR rates vary over 4 orders of magnitude. In the molecular region, however, a CR rate that is an order of magnitude higher gives a similar rise in the electron fractional abundance, giving ranges xe ~ 10-9−10-5 and 10-7−10-2 for the high and low density models, respectively. Adding mechanical heating (1b and 1c) does not change the electron abundance much. The difference in fractional electron abundance between the highest and lowest CR rate is somewhat larger than for the models without mechanical heating.
H and H2 abundances (Fig.
2):
atomic hydrogen is by far the dominant species in the radical region
(NH ≲ 2−3 × 1021 cm-2), but when the
attenuating column becomes larger, molecular hydrogen becomes more and more abundant. For
the canonical CR rate (ζ = 5 × 10-17 s-1), the
atomic hydrogen abundance drops below xH ~ 10-4
(10-2) for the high (low) density models. The H to H2 transition
becomes less and less complete for higher CR rates, because of CR reactions such as
H2 + CR → H + H+ + e− and
 . Atomic and
molecular hydrogen are of similar abundance for the highest adopted CR rate in the high
density case, while atomic hydrogen is dominant for CR rates
ζ > 5 × 10-15 s-1 in the
low density case.
. Atomic and
molecular hydrogen are of similar abundance for the highest adopted CR rate in the high
density case, while atomic hydrogen is dominant for CR rates
ζ > 5 × 10-15 s-1 in the
low density case.
C+, C, and CO abundances (Fig. 2): similar trends are seen for the C+/C/CO transition. For the lowest CR rate (ζ = 5 × 10-17 s-1), there are three well-defined zones where one species is most abundant. Higher CR rates lead to higher neutral carbon abundances in the unattenuated part of the cloud by a factor of ~3 (~30) in the high (low) density case. However, the abundances are still low compared to that of C+. Again the greatest effect is seen at large column density (NH > 1022 cm-2). The C+ and C abundances increase very rapidly with the CR rate. In the high density case, the C+ and C abundances become 10-6−10-5 and 3−6 × 10⁻⁵, respectively, depending on the amount of additional mechanical heating. There is no full transition to CO for ζ ≥ 5 × 10-15 s-1 in the low density case. Neutral carbon is the dominant species at high column density ζ = 5 × 10-15 s-1, C+ becomes the dominant species at ζ ≥ 5 × 10-14 s-1, and at the same time there is almost no CO left (xCO < 10-6).
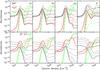 |
Fig. 4 Abundances of OH+, H2O+, H3O+, O+, OH, and H2O for all models sets (see Table 1). Line styles corresponding to the different CR rates are the same as in Fig. 1. |
H+,  , and
, and
 abundances
(Fig. 3): the main drivers of chemistry in PDRs are
ionic species, starting with species H+,
, and
. Both H+
and are mainly
(directly or indirectly) produced by cosmic ray ionization
(H + CR → H+ + e−;
abundances
(Fig. 3): the main drivers of chemistry in PDRs are
ionic species, starting with species H+,
, and
. Both H+
and are mainly
(directly or indirectly) produced by cosmic ray ionization
(H + CR → H+ + e−;  or
H+ + H + e− or H + H). UV photons of energy higher than
13.6 eV are all readily absorbed in a very small column, forming an HII region in front of
the PDR. H2 can only be photodissociated to two hydrogen atoms (with a
UV-excited
or
H+ + H + e− or H + H). UV photons of energy higher than
13.6 eV are all readily absorbed in a very small column, forming an HII region in front of
the PDR. H2 can only be photodissociated to two hydrogen atoms (with a
UV-excited  as intermediate),
no ionic species are produced by direct photoionization of H2. Therefore, the
abundances of ionic species are affected significantly by variations in the cosmic ray
rate.
as intermediate),
no ionic species are produced by direct photoionization of H2. Therefore, the
abundances of ionic species are affected significantly by variations in the cosmic ray
rate.
In the unshielded region, the abundance increases of H+ and
scale with the
ionization rate. H+ is directly produced by cosmic ray ionization. The
abundance is
balanced by the charge exchange reactions  . The reaction to the right has an
energy barrier of T ~ 20 000 K, and is only efficient at temperatures
of a few thousand Kelvin. Therefore, the abundance may
still increase with CR rate: the lower H2 abundance at higher CR rates is
counteracted by a temperature increase (see Fig. 1).
At slightly larger column densities
(NH ~ 3 × 1021 cm-2), the temperature
drops and only
. The reaction to the right has an
energy barrier of T ~ 20 000 K, and is only efficient at temperatures
of a few thousand Kelvin. Therefore, the abundance may
still increase with CR rate: the lower H2 abundance at higher CR rates is
counteracted by a temperature increase (see Fig. 1).
At slightly larger column densities
(NH ~ 3 × 1021 cm-2), the temperature
drops and only  is efficient, while
the H to H2 transition occurs simultaneously. These together result in an
abundance maximum of H+, and also explain why the
abundance does not
increase as rapidly as the H2 abundance.
is efficient, while
the H to H2 transition occurs simultaneously. These together result in an
abundance maximum of H+, and also explain why the
abundance does not
increase as rapidly as the H2 abundance.
After the H to H2 transition (NH ≳ 5 × 1021 cm-2), the overall ionization degree drops, which coincides with a decrease in temperature. This is mostly explained by recombination reactions (e.g., H+ + e− → H + Photon), which are more efficient at lower temperatures. In this region, the increase in H+ with cosmic ray rate is more rapid than linear. The H to H2 transition is less complete for higher CR rates (Fig. 2), producing a larger reservoir of atomic hydrogen that can potentially be ionized.
is formed and
destroyed by  and
and
 and H2 + H,
respectively. At low column densities, the abundance
decreases with CR rates because of the enhanced electron and reduced H2
abundances. At higher column densities, increases for
high CR rates, but not one to one with the CR rate, owing to more efficient recombination
and lower H2 abundances (especially in the low density models).
and H2 + H,
respectively. At low column densities, the abundance
decreases with CR rates because of the enhanced electron and reduced H2
abundances. At higher column densities, increases for
high CR rates, but not one to one with the CR rate, owing to more efficient recombination
and lower H2 abundances (especially in the low density models).
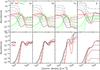 |
Fig. 5 Abundances of N+, NH+,
|
CH+,  , and
CH abundances (Fig. 3): in the unshielded region of the cloud, the
formation of CH+ occurs mainly by means of
, and
CH abundances (Fig. 3): in the unshielded region of the cloud, the
formation of CH+ occurs mainly by means of
 , where
 is vibrationally
excited molecular hydrogen. Therefore, the CH+ abundances do not change much
with cosmic ray rate in the unshielded region of the cloud. However, at larger column
densities (NH ~ 1022 cm-2), the main
route is through
is vibrationally
excited molecular hydrogen. Therefore, the CH+ abundances do not change much
with cosmic ray rate in the unshielded region of the cloud. However, at larger column
densities (NH ~ 1022 cm-2), the main
route is through  . At high density, both the
and C abundances
increase by orders of magnitude for the higher CR rates, and as a result the
CH+ abundance as well, despite the higher electron abundance. In the low
density case, the CH+ abundances are very similar for all CR rates because
there is no boost now through C + . The
formation
occurs mainly by means of
. At high density, both the
and C abundances
increase by orders of magnitude for the higher CR rates, and as a result the
CH+ abundance as well, despite the higher electron abundance. In the low
density case, the CH+ abundances are very similar for all CR rates because
there is no boost now through C + . The
formation
occurs mainly by means of  and
closely follows the abundance of CH+, except where molecular hydrogen is not
the dominant species, i.e., in the radical region in the high density case and for very
high CR rates in the low density case.
and
closely follows the abundance of CH+, except where molecular hydrogen is not
the dominant species, i.e., in the radical region in the high density case and for very
high CR rates in the low density case.
CH can be formed by the neutral-neutral reactions C + H2 → CH + H and
C + OH → CH + O, which have energy barriers of T ~ 11 700 and 14 800 K,
respectively, and the recombination reaction  .
Destruction occurs by means of UV photodissociation and photoionization at small column
densities, and by fast charge exchange reactions (e.g.,
H+ + CH → CH+ + H) at all column densities. At small column
densities (NH ≲ 1021 cm-2), the CH
abundances are fairly similar, and UV photoionization dominates the destruction, and
neutral-neutral reactions formation. The small differences can be explained by small
deviations in H2 and C abundances. At column densities
NH ≳ 5 × 1021 cm-2, the formation is
dominated by the recombination of , and the
abundance is mainly determined by the CR rate.
.
Destruction occurs by means of UV photodissociation and photoionization at small column
densities, and by fast charge exchange reactions (e.g.,
H+ + CH → CH+ + H) at all column densities. At small column
densities (NH ≲ 1021 cm-2), the CH
abundances are fairly similar, and UV photoionization dominates the destruction, and
neutral-neutral reactions formation. The small differences can be explained by small
deviations in H2 and C abundances. At column densities
NH ≳ 5 × 1021 cm-2, the formation is
dominated by the recombination of , and the
abundance is mainly determined by the CR rate.
Water chemistry (Fig. 4): H2O and related species,
OH+, OH, H2O+, and H3O+ are
significantly affected by cosmic rays. First we consider H2O. It can be formed
by the neutral-neutral reaction H2 + OH → H2O + H, for which
temperatures T > 200−300 K are required. Cosmic
rays are unable to increase the temperature to above this threshold, not even at the
highest cosmic ray rates. Another important route, especially when gas is significantly
ionized by enhanced cosmic ray rates, is, e.g.,  , then
OH+ + H2 → H2O+ + H,
H2O+ + H2 → H3O+ + H,
followed by recombination,
H3O+ + e− → H2O + H. Destruction is
possible by UV photodissociation, charge exchange, proton transfer, ion-molecule
reactions, and cosmic rays. Important routes are
He+ + H2O → OH + He + H+ and
H+ + H2O → H2O+ + H, and varying the
cosmic ray rates affects these abundances. Therefore, at intermediate column densities
NH ~ 3 × 10²¹ to 1022 cm-2
in model sets 1a and 1b, the water abundances are higher for higher CR rates. In these
models, the temperatures are not high enough to form H2O by neutral-neutral
reactions. When the temperature is high enough to form water (model set 1c) by the
neutral-neutral reactions, a higher ionization degree is a drawback (H2O is
destroyed by, e.g., He+), and the water abundance decreases for very high CR
rates (ζ ≳ 5 × 10-14 s-1). In model set 2, there is
not enough H2 at the higher cosmic ray rates to form water by ion-molecule
reactions.
, then
OH+ + H2 → H2O+ + H,
H2O+ + H2 → H3O+ + H,
followed by recombination,
H3O+ + e− → H2O + H. Destruction is
possible by UV photodissociation, charge exchange, proton transfer, ion-molecule
reactions, and cosmic rays. Important routes are
He+ + H2O → OH + He + H+ and
H+ + H2O → H2O+ + H, and varying the
cosmic ray rates affects these abundances. Therefore, at intermediate column densities
NH ~ 3 × 10²¹ to 1022 cm-2
in model sets 1a and 1b, the water abundances are higher for higher CR rates. In these
models, the temperatures are not high enough to form H2O by neutral-neutral
reactions. When the temperature is high enough to form water (model set 1c) by the
neutral-neutral reactions, a higher ionization degree is a drawback (H2O is
destroyed by, e.g., He+), and the water abundance decreases for very high CR
rates (ζ ≳ 5 × 10-14 s-1). In model set 2, there is
not enough H2 at the higher cosmic ray rates to form water by ion-molecule
reactions.
OH is formed by H2 + O → OH + H or the destruction of water (see previous paragraph). In the radical region where temperatures are significant, formation by neutral reactions dominates. In the high density models, they are closely related to the H2 abundance, and here the OH abundance is slightly lower for the high CR rates. In the low density case, the OH abundance increases with CR rate in the radical region, since the temperature increases by about an order of magnitude. When temperatures are lower, i.e., at NH ≳ 5 × 1021 cm-2, the contribution of water destruction becomes more important. OH abundances are significantly larger in model sets 1a and 1b, when CR rates are higher. In model set 1c, formation by neutral-neutral reactions becomes more important, and the effect of an enhanced CR rate less evident.
OH+ is formed by H+ + OH → OH+ + H and H+ + O → O+ + H followed by O+ + H2 → OH+ + H or by photoionization of OH. At small column densities, where OH+ abundances are very similar for different CR rates, the abundance is determined by the UV ionization of OH. At large column densities (NH ≳ 5 × 1021 cm-2), the UV is almost completely attenuated, and here the H+ driven formation, which is enhanced by cosmic rays, is more important. H2O+ closely follows the OH+ abundance at these high column densities. It is mainly formed by H2 + OH+ → H2O+ + H, and also very much higher at higher CR rates.
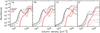 |
Fig. 6 Abundances of HCO+ and CS for all model sets (see Table 1). Line styles corresponding to the different CR rates are the same as in Fig. 1. |
Nitrogen chemistry (Fig. 5): N+ has an ionization
potential of 14.53 eV, which is too high for the available UV photons. This species shows
orders of magnitude variations for all model sets. The species is strongly affected by the
higher cosmic ray rate. NH+ and  are closely
connected to the cosmic ray rate at high column densities, because the formation is driven
by
are closely
connected to the cosmic ray rate at high column densities, because the formation is driven
by  and
N+ + H2.
and
N+ + H2.
HCN and HNC do not show a strong response to enhanced CR rates in the high density case
without mechanical heating, and the abundances remain similar for all CR rates. Adding
mechanical heating (1b), however, drives the HNC + H → HCN + H reaction that has a
temperature barrier of T ~ 200 K, and HCN has an abundance that is two
orders of magnitude higher than HNC. In the low density case (2), both the HCN and HNC
abundances, which are similar, decrease rapidly with increasing cosmic ray rates. This is
a direct result of the decrease in H2 and
, which are
important in the formation of these molecules.
HCO+ and CS (Fig. 6): for model sets 1a and 1b, the
HCO+ abundances are enhanced with increasing CR rates. The formation occurs
through  , which is fast at
all temperatures, and is aided by CH + O → HCO+ + e− at high
temperatures. Destruction happens by means of recombination with electrons but also
reactions with molecules such as H2O, OH, and HCN. In model set 1b, the
abundances of these species are especially enhanced for the lower
(ζ = 5 × 10-17 and 5 × 10-16 s-1)
cosmic ray rates as discussed in the previous paragraphs, and suppress the HCO+
abundance compared to the models without mechanical heating. In the low density models
(2), where the full transition to H2 does not occur, the
abundance is also
automatically suppressed, giving smaller abundances with increasing cosmic ray rates.
, which is fast at
all temperatures, and is aided by CH + O → HCO+ + e− at high
temperatures. Destruction happens by means of recombination with electrons but also
reactions with molecules such as H2O, OH, and HCN. In model set 1b, the
abundances of these species are especially enhanced for the lower
(ζ = 5 × 10-17 and 5 × 10-16 s-1)
cosmic ray rates as discussed in the previous paragraphs, and suppress the HCO+
abundance compared to the models without mechanical heating. In the low density models
(2), where the full transition to H2 does not occur, the
abundance is also
automatically suppressed, giving smaller abundances with increasing cosmic ray rates.
The sulfur chemistry contains many reactions with activation barriers. CS has two
formation channels, the first through S + CH → CS + H and the second through
S + H2 → HS + H (with an energy barrier of T ~ 6000 K)
followed by HS + C → CS + H. CS is most abundant at column densities
NH ≳ 5 × 1021 cm-2, where temperatures
are not such that the second channel is very effective, although not insignificant in
model set 2. On the other hand, the formation of CH is dependent on
, of which the
abundance is highly dependent on CR rate. Destruction happens through ion-molecule
reactions with, e.g., He+, H+,
, which are also
dependent on CR rate. The abundance is a very complex interplay between temperature and
ionization rates (cf., Leen & Graff 1988;
Meijerink et al. 2008). The abundance of CS
increases with CR rate in model sets 1a and 1b, while model set 1c exhibits a sharp
decline. Molecule formation becomes more and more ineffective in the low density case, and
the CS abundance decreases significantly with CR rate, similar to, e.g., HCN and HNC.
Column densities for model set 1a.
Column densities for model set 1b.
Column densities for model set 1c.
Column densities for model set 2.
3. Integrated column densities
3.1. Trends
The integrated column densities for the total cloud (NH = 3 × 1022 cm-2) are shown in Tables 2 to 5 for the species discussed in the previous section. The main results are summarized in Fig. 7.
Hydrogen chemistry (top row Fig. 7): the integrated column densities of
atomic and molecular hydrogen vary over a factor of 3 (10) for the high (low) density
models over the whole range of cosmic ray rates. The ionic species of hydrogen,
H+, , and
, show much larger
variations. The column densities of N(H+) vary from
~1016−1018 cm-2
(1017−1020 cm-2) for the high (low density models).
increases
(decreases) by 4 (2) orders of magnitude in the high (low) density case.
Water chemistry (row 2 and 3 of Fig. 7): the O+ column densities are quite strongly correlated with CR rate, and increase by two to three orders of magnitude over the range of considered CR rates. Although there are large variations in absolute column densities for OH and H2O between the different models, the OH/H2O ratio increases with cosmic ray rate, from N(OH)/N(H2O) ~ 4 × 10⁻³ (~0.2) to ~1−3 (~400) for the high (low) density models.
The OH+ and H2O+ show a strong response to the CR rate for ζ ≳ 5 × 10-15 s-1 in the high density case. Above this threshold, the column density increases by a factor ~10−20 for OH+ and ~50−60 for H2O+. In the low density case, the column densities for both species show a steep rise with CR rate up to ζ ~ 5 × 10-14 s-1, after which it levels off for OH+ and decreases for H2O+. The trends of H3O+ generally show an increase (decrease) with CR rate in the high (low) density case. The response is more direct when high mechanical heating is added and temperatures are higher.
CO+ and HCO+ (row 4 in Fig. 7): HCO+ does not show an obvious trend with increasing CR rates in the high density case. The HCO+ abundance anti-correlates with CR rate in the low density case. It does not seem to be a tracer that can be easily used as a CR tracer, but it does provide information when used in combination with e.g. the water chemistry. CO+ is very irresponsive to the CR rates at high density except for very high CR rates (ζ > 5 × 10-14 s-1). In the low density case, N(CO+) does not show a very obvious trend.
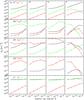 |
Fig. 7 Column densities of diagnostic species. |
C+, N+, and C (bottom row in Fig. 7): neutral and singly ionized carbon have very constant column densities over the range of CR rates considered. On the other hand, N+ correlates very well with the CR rates, and hence the N+/C or N+/C+ column density ratio can be used as a diagnostic in estimating the CR rate.
Other species: despite many species exhibiting large
local variations in a cloud when varying CR rates, it does not always
result in significant changes in the integrated column densities in high density clouds.
Examples are CH+ and which are the
same within five percent over the whole range. In the low density models, variations are
larger, but the integrated column densities are one or two orders of magnitude smaller.
There are also species that are not easy to interpret, such as NH+,
, and CS.
3.2. Uncertainties
Molecular hydrogen, H2, is a key species in the chemistry of the ISM. The formation of H2, which mainly occurs on grain surfaces at these densities and metallicity, depends on the specific properties and temperatures of the grains, and is subject to considerable uncertainty (cf., Cazaux & Tielens 2004). As a result the H2 gas phase abundance is also uncertain, especially when the gas is not predominantly molecular, i.e., in the radical region.
Therefore, the column densities of key species such as O+, OH, OH+, and H2O+ might be affected, especially when the integrated column density is dominated by the abundances in the radical region. To investigate this, we lowered the H2 formation rate by a factor 3, and here we summarize the results for some of the species, considering model set 1a:
H2, , and
H+: the abundance of H2 is lower by a
factor of ~3 in the unshielded region of the cloud, and the H to H2
transition occurs now more gradually. In the molecular region, there is only a noticeable
effect when there is no full transition to H2, which is for the highest
considered CR rate, ζ = 5 × 10-13 s-1. The column
density of atomic hydrogen is ~10 percent higher for the lowest up to ~80 percent
higher for the highest CR rate. Molecular hydrogen column densities only change
significantly for the two highest CR rates, becoming ~20 and ~40 percent lower,
respectively.
The H+ column density is lower by a factor ~3 for the lowest and ~5 to
~15 percent higher for the highest two CR rates. The H+ column density is
dominated by + H →
H+ + H2 in the radical region at
ζ = 5 × 10-17 s-1 and thus lower, while at higher
CR rates the column density is higher because of the only partial transition to
H2
O+, OH, OH+, H2O and H2O+, and H3O+: the trend seen for the O+ column density is very close to what is seen for H+, i.e, a factor of ~3 lower for ζ = 5 × 10-17 s-1, while slightly higher for the highest CR rates. Similar trends are seen for OH+ and H2O+.
Line intensities for model set 1a.
Line intensities for model set 1b.
Line intensities for model set 1c.
H2O is only significantly affected (lowered by a factor ~2) at the highest CR rate. OH column density is lower by a factor ~3 for the lowest CR rates, and dominated by the abundance in the unshielded region of the cloud. This difference is much less (5–30 percent) for the higher CR rates. H2O and H3O+ column densities are only affected for the highest two CR rates.
In all, we conclude that the overall trends are not affected by uncertainties in the H2 abundance, the main driver of the species of interest in our paper. The largest changes are seen when the integrated column density of a species is dominated by its abundance in the radical region, i.e., in the models with low CR rates.
4. Integrated line fluxes
Line fluxes for a number of species discussed in the previous section are shown in Tables 6 to 9. Here we highlight the main results:
Fine-structure lines: the two important cooling lines, [OI] 63 μm and [CII] 158 μm, which mainly determine the energy budget of interstellar clouds, have very similar fluxes for different CR rates in the high density case. [OI] 63 μm is the same within a factor of 2 in the high density case for all mechanical heating and CR rates, but does increase by a factor of 5 in the low density case. The critical density for excitation of the [OI] 63 μm is ncrit = 5 × 105 cm-3, and the low density model is not even close to being thermalized, and temperature differences cause a large change in emitted flux. The [CII] 158 μm has a very low critical density ncrit = 2.8 × 103 cm-3, and the increase in fluxes is not explained by the rise in temperature at small column densities. Additional flux is emitted in low density clouds, because there is no full transition to neutral carbon and CO, for the highest CR rates (see Sect. 2). This also explains why the two neutral carbon lines, [CI] 610 μm and [CI] 370 μm, show an increase in the high density models. The low density models have a maximum intensity at ζ ~ 5 × 10-15 s-1, since for higher CR rates the main carbon budget remains in C+. The two ionized nitrogen lines, [NII] 205 μm and [NII] 122 μm, increase by 4 (3) orders of magnitude in the high (low) density case. Low density clouds, in particular, are expected to yield detectable fluxes: the [NII] 122 μm lines has only a 10 times weaker flux than the [CII] line at the highest CR rate. Unfortunately, O+ does not have fine-structure transitions in the mid and far-infrared. Available transitions are in the visible and UV, and have very high excitation energies.
95 μm:
this transition is calculated following the discussion in Pan & Oka (1986). The fluxes in the high density case are very similar to
the [NII] 122 μm, not extremely strong, but potentially detectable, when
clouds are exposed to very high CR fluxes.
HCN, HNC, and HCO+: the HCN and HNC do not seem to be very helpful in the discussion of cosmic ray rates, as there are no obvious trends. The HCN/HNC ratio does show a response to mechanical heating as already pointed out in Loenen et al. (2008), and HCN in particular is boosted by a few orders of magnitude. An exception is the high density with the high CR rate, where He+ destroys the HCN and HNC very effectively. In addition, HCO+ does not exhibit very obvious trends, except for very high mechanical heating rates (model set 1c).
CO and 13CO: in the high density models, there is very little response when increasing the cosmic ray flux. Fluxes are boosted, when mechanical heating plays an important role in the energy budget of the gas, but, in contrast to the HCN and HNC lines, it only affects high-J transitions. When 13CO line fluxes are also available, mechanical heating effects are potentially also seen in the lower-J transitions (J ≲ 3). The CO to 13CO line ratio increases, indicative of smaller optical depths, while CO fluxes only decrease by a factor of 2.
Line intensities for model set 2.
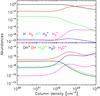 |
Fig. 8 Abundances of hydrogen and water chemistry for an XDR model with density n = 105.5 cm-3 and Fx = 28.5 erg cm-2 s-1. |
5. Key diagnostics
The aim of this paper is to identify potential line diagnostics that can be used to trace an enhanced cosmic-ray radiation field and mechanical heating in the presence of starformation such as the central regions of Arp 220 and NGC 253. One of the remarkable results is that many commonly observed lines, such as, the [OI] 63 μm, [CI] 609 μm, [CII] 158 μm, and low-J CO lines, show very moderate responses to high cosmic ray rates and mechanical feedback, when the medium is already exposed to large amounts of UV. This is a very useful result, since these lines can serve as a reference point to other affected line fluxes.
5.1. Tracers of mechanical heating
Mechanical heating only increases the temperature of the gas, leaving the ionization fraction unaffected. Tracing this heating mechanism with molecules that contain activation barriers in their formation route is thus very useful. Lines of, e.g., HCN and H2O become stronger relative to the aforementioned fine-structure lines, especially for the highest considered mechanical heating rate. It was already pointed out by Loenen et al. (2008) that the HCN/HNC line ratios increase when mechanical heating is important, since at high temperatures the HNC will be driven in to HCN (see also Sect. 2). Moreover, the HCN/CO line ratios also increase when mechanical heating effects are important, but the interpretation of an observed ratio is not straightforward, because the lines trace slightly different regions.
5.2. Tracers of enhanced cosmic-ray rates
The [NII] fine-structure lines show a very strong response to enhanced cosmic ray rates, independent of mechanical heating effects. The main concern with these lines, however, is that one has to distinguish the contributions arising from these CR exposed clouds and HII regions that also contribute a significant amount of [NII] emission in starforming environments.
It would be invaluable to study lines of species that trace the water chemistry, especially when the ionized water related species are considered. The OH to H2O column density ratio varies by over two to three orders of magnitude for the cosmic ray rates considered, from ~5 × 10⁻³ (ζ = 5.0 × 10⁻¹⁷ s-1) to ~1−3 (ζ = 5.0 × 10⁻¹³ s-1) in the high density case, and ~0.2 to ~400 in the low density case. Hence, the OH lines are generally expected to be stronger relative to the water lines for higher cosmic ray rates. Figure 8 shows an XDR model of density n = 105.5 cm-2, and radiation field FX = 28.5 erg cm-2 s-1 (a radiation field at a distance of ~170 pc from a typical AGN with LX = 1044 erg/s). From this, we infer that the ratio varies between eight (integrated up to NH = 3 × 1022 cm-2) and one (NH = 1024 cm-2), so for very high CR rates, the ratios become comparable to that of a typical X-ray illuminated cloud.
van der Tak et al. (2008) already pointed out that the H3O+/H2O ratio is influenced by either cosmic rays or X-rays. The high density models exhibit variations over 1 to 2 orders of magnitude in the high density case. Unfortunately, the interpretation is not entirely unambiguous, since the H3O+ abundance decreases for the highest CR rates. Clouds illuminated by high CR rates also have similar ratios as those exposed to X-rays, namely (1−6) × 10-3 (ζ = 5 × 10-14 s-1) and (5−10) × 10-3 (ζ = 5 × 10-13 s-1) for model set 1, and in the range (15−4) × 10-3 (depending on the size of the cloud) for the XDR model shown in Fig. 8.
The current study has revealed that additional observations of OH+ and H2O+ might help in distinguishing very high CR rates from a typical XDR. The OH+ and H2O+ abundances are significantly higher for CR rates that are 103−104 times higher than the accepted Milky Way value, but not as much as in the XDR. The OH+/OH and H2O+/H2O column density ratios can be as high as (3−5) × 10-4 and (2−14) × 10-4, respectively, compared to (250−7.5) × 10-4 and (64−4) × 10-3 (NH = 3 × 10²²−1024 cm-2). Thus, we can distinguish XDRs and regions with enhanced CR rates when all species are considered.
In this paper, no attempt has been made to model lines from these species. As already pointed out in e.g., González-Alfonso et al. (2008), the radiation transfer of OH and H2O involves the consideration of both collisions and radiation pumping, which is beyond the scope of this paper. In addition, OH+ and H2O+ lines are not easily modeled. These species have formation and destruction timescales that are similar to those for excitation. Collisional cross-sections are also unavailable at the moment, and quantum mechanical calculations would be needed to obtain them.
6. Outlook
OH+ and H2O+ have already been detected in a number of sources:
-
Van der Werf et al. (2010) detected OH+ and H2O+ emission lines in the ULIRG Mrk 231, which are about 30 percent of the strength of the CO(5–6) to CO(13–12) lines. The paper illustrates that these lines are caused by AGN activity in Mrk 231.
-
In the Milky Way, OH+ was detected in absorption toward Sagittarius B2 using the Atacama Pathfinder Experiment (APEX) by Wyrowski et al. (2010), who measured a column density of 2.4 × 1015 cm-2. Ossenkopf et al. (2010) detected H2O+ in absorption toward, NGC 6334, DR21, and Sgr B2, obtaining column densities of 7.2 × 1012 cm-2, 2.3 × 1013 cm-2, and 1.1 × 1015 cm-2, respectively. These Galactic observations relate these species to the diffuse ISM.
Extensive modeling of the excitation of water-related species is very timely, since more and more observations will be available on a very short timeframe from observations with the recently lauched Herschel Space Telescope.
Acknowledgments
We thank Padelis Papadopoulos for useful discussions. We thank the anonymous referee for a careful reading of the manuscript and constructive comments.
References
- Acero, F., Aharonian, F., Akhperjanian, A. G., et al. 2009, Science, 326, 1080 [NASA ADS] [CrossRef] [PubMed] [Google Scholar]
- Asplund, M., Grevesse, N., & Sauval, A. J. 2005, in Cosmic Abundances as Records of Stellar Evolution and Nucleosynthesis, ed. T. G. Barnes III, & F. N. Bash, ASP Conf. Ser., 336, 25 [Google Scholar]
- Baan, W. A., Henkel, C., Loenen, A. F., Baudry, A., & Wiklind, T. 2008, A&A, 477, 747 [NASA ADS] [CrossRef] [EDP Sciences] [Google Scholar]
- Baan, W. A., Loenen, A. F., & Spaans, M. 2010, A&A, 516, A40 [NASA ADS] [CrossRef] [EDP Sciences] [Google Scholar]
- Bakes, E. L. O., & Tielens, A. G. G. M. 1994, ApJ, 427, 822 [NASA ADS] [CrossRef] [Google Scholar]
- Cazaux, S., & Tielens, A. G. G. M. 2004, ApJ, 604, 222 [NASA ADS] [CrossRef] [Google Scholar]
- Gao, Y., & Solomon, P. M. 1999, ApJ, 512, L99 [NASA ADS] [CrossRef] [Google Scholar]
- Gao, Y., Solomon, P. M., Downes, D., & Radford, S. J. E. 1997, ApJ, 481, L35 [NASA ADS] [CrossRef] [Google Scholar]
- González-Alfonso, E., Smith, H. A., Ashby, M. L. N., et al. 2008, ApJ, 675, 303 [NASA ADS] [CrossRef] [Google Scholar]
- Hocuk, S., & Spaans, M. 2010, A&A, 522, A24 [NASA ADS] [CrossRef] [EDP Sciences] [Google Scholar]
- Hollenbach, D. J., & Tielens, A. G. G. M. 1999, Rev. Mod. Phys., 71, 173 [Google Scholar]
- Jenkins, E. B. 2004, Origin and Evolution of the Elements, 336 [Google Scholar]
- Kaufman, M. J., Wolfire, M. G., Hollenbach, D. J., & Luhman, M. L. 1999, ApJ, 527, 795 [NASA ADS] [CrossRef] [Google Scholar]
- Klessen, R. S., Spaans, M., & Jappsen, A. 2007, MNRAS, 374, L29 [NASA ADS] [CrossRef] [Google Scholar]
- Leen, T. M., & Graff, M. M. 1988, ApJ, 325, 411 [NASA ADS] [CrossRef] [Google Scholar]
- Lepp, S., & Dalgarno, A. 1996, A&A, 306, L21 [NASA ADS] [Google Scholar]
- Loenen, A. F. 2009, Ph.D. Thesis, Kapteyn Astronomical Institute [Google Scholar]
- Loenen, A. F., Spaans, M., Baan, W. A., & Meijerink, R. 2008, A&A, 488, L5 [NASA ADS] [CrossRef] [EDP Sciences] [Google Scholar]
- Lonsdale, C. J., Diamond, P. J., Thrall, H., Smith, H. E., & Lonsdale, C. J. 2006, ApJ, 647, 185 [NASA ADS] [CrossRef] [Google Scholar]
- Maloney, P. R., Hollenbach, D. J., & Tielens, A. G. G. M. 1996, ApJ, 466, 561 [NASA ADS] [CrossRef] [Google Scholar]
- Meijerink, R., & Spaans, M. 2005, A&A, 436, 397 [NASA ADS] [CrossRef] [EDP Sciences] [Google Scholar]
- Meijerink, R., Spaans, M., & Israel, F. P. 2006, ApJ, 650, L103 [NASA ADS] [CrossRef] [Google Scholar]
- Meijerink, R., Spaans, M., & Israel, F. P. 2007, A&A, 461, 793 [NASA ADS] [CrossRef] [EDP Sciences] [Google Scholar]
- Meijerink, R., Glassgold, A. E., & Najita, J. R. 2008, ApJ, 676, 518 [NASA ADS] [CrossRef] [Google Scholar]
- Ossenkopf, V., Müller, H. S. P., Lis, D. C., et al. 2010, A&A, 518, L111 [NASA ADS] [CrossRef] [EDP Sciences] [Google Scholar]
- Pan, F., & Oka, T. 1986, ApJ, 305, 518 [NASA ADS] [CrossRef] [Google Scholar]
- Papadopoulos, P. P. 2010, ApJ, 720, 226 [NASA ADS] [CrossRef] [Google Scholar]
- Rodríguez-Rico, C. A., Goss, W. M., Viallefond, F., et al. 2005, ApJ, 633, 198 [NASA ADS] [CrossRef] [Google Scholar]
- Sakamoto, K., Aalto, S., Wilner, D. J., et al. 2009, ApJ, 700, L104 [NASA ADS] [CrossRef] [Google Scholar]
- Sanders, D. B., & Mirabel, I. F. 1996, ARA&A, 34, 749 [NASA ADS] [CrossRef] [Google Scholar]
- Smith, H. E., Lonsdale, C. J., Lonsdale, C. J., & Diamond, P. J. 1998, ApJ, 493, L17 [NASA ADS] [CrossRef] [Google Scholar]
- Soifer, B. T., Neugebauer, G., & Houck, J. R. 1987, ARA&A, 25, 187 [NASA ADS] [CrossRef] [Google Scholar]
- van der Tak, F. F. S., & van Dishoeck, E. F. 2000, A&A, 358, L79 [NASA ADS] [Google Scholar]
- van der Tak, F. F. S., Aalto, S., & Meijerink, R. 2008, A&A, 477, L5 [NASA ADS] [CrossRef] [EDP Sciences] [Google Scholar]
- van der Werf, P. P., Isaak, K. G., Meijerink, R., et al. 2010, A&A, 518, L42 [NASA ADS] [CrossRef] [EDP Sciences] [Google Scholar]
- Wyrowski, F., Menten, K. M., Güsten, R., & Belloche, A. 2010, A&A, 518, A26 [NASA ADS] [CrossRef] [EDP Sciences] [Google Scholar]
All Tables
All Figures
|
Fig. 1 Temperatures for all models sets (see Table 1) for cosmic ray rates ζ = 5 × 10-17 (solid line), 5 × 10-16 (dotted), 5 × 10-15 (dashed), 5 × 10-14 (dot-dashed), and 5 × 10-13 s-1 (dotted-dashed). |
| In the text | |
|
Fig. 2 Abundances of H, H2, e−, C+, C and CO for all models sets (see Table 1). Line styles corresponding to the different CR rates are the same as in Fig. 1. |
| In the text | |
|
Fig. 3 Abundances of H+, |
| In the text | |
|
Fig. 4 Abundances of OH+, H2O+, H3O+, O+, OH, and H2O for all models sets (see Table 1). Line styles corresponding to the different CR rates are the same as in Fig. 1. |
| In the text | |
|
Fig. 5 Abundances of N+, NH+,
|
| In the text | |
|
Fig. 6 Abundances of HCO+ and CS for all model sets (see Table 1). Line styles corresponding to the different CR rates are the same as in Fig. 1. |
| In the text | |
|
Fig. 7 Column densities of diagnostic species. |
| In the text | |
|
Fig. 8 Abundances of hydrogen and water chemistry for an XDR model with density n = 105.5 cm-3 and Fx = 28.5 erg cm-2 s-1. |
| In the text | |
Current usage metrics show cumulative count of Article Views (full-text article views including HTML views, PDF and ePub downloads, according to the available data) and Abstracts Views on Vision4Press platform.
Data correspond to usage on the plateform after 2015. The current usage metrics is available 48-96 hours after online publication and is updated daily on week days.
Initial download of the metrics may take a while.