Fig. 9
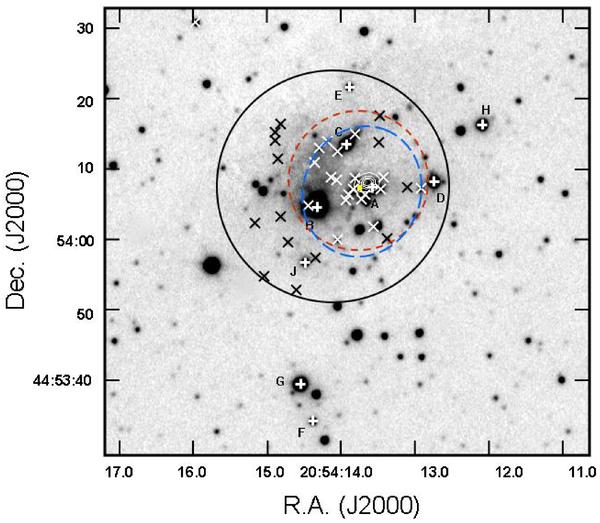
K-band image of the central region of G85.40-0.00 showing the spatial distribution of the IR-excess sources, believed to be cluster members, listed in Table 2. The signs × refer to those sources with K-band excesses or have H − K > 2 and are too faint to be detected in J, and the signs + refer to those sources with four measured IRAC colours. The 6 cm contours (Urquhart et al. 2009) are superimposed in white. The position of the methanol maser is marked with a yellow square, while the highest contours on the SCUBA 850 μm and MIPS 70 μm maps are shown schematically with long (red) and short (blue) dashed lines, respectively. A colour version of this figure is available in the electronic edition.
Current usage metrics show cumulative count of Article Views (full-text article views including HTML views, PDF and ePub downloads, according to the available data) and Abstracts Views on Vision4Press platform.
Data correspond to usage on the plateform after 2015. The current usage metrics is available 48-96 hours after online publication and is updated daily on week days.
Initial download of the metrics may take a while.