Fig. 10
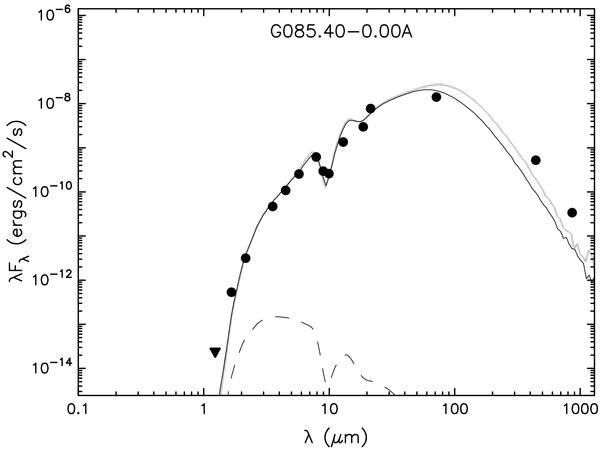
Spectral energy distribution (SED) of source G8540A using the NICS (1.2 to 2.2 μmm), IRAC (3.6 to 8 μmm), CID (9 to 17 μmm), MSX (23 μmm), MIPS (70 μmm) and SCUBA (450 and 850 μmm) mesurements. The two best-fit models of the SED derived from the Robitaille et al. (2007) fitting tool are over-plotted with solid lines. The dashed line represents the stellar photosphere used as input to the radiation transfer code. The parameters of the model that best fit the SED (dark solid line) are listed in Table 4.
Current usage metrics show cumulative count of Article Views (full-text article views including HTML views, PDF and ePub downloads, according to the available data) and Abstracts Views on Vision4Press platform.
Data correspond to usage on the plateform after 2015. The current usage metrics is available 48-96 hours after online publication and is updated daily on week days.
Initial download of the metrics may take a while.