Fig. 8
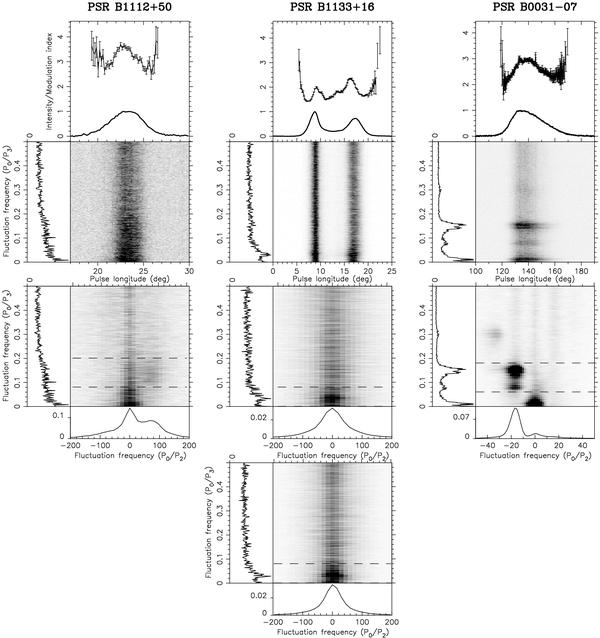
Plots of the fluctuation analysis for the PSRs B1112+50, B1133+16, and B0031−07. The average pulse profile, and the longitude-resolved modulation index (LRMI) are shown in the uppermost panels. The panels directly below the average pulse profile present the longitude-resolved fluctuation spectrum (LRFS). The two-dimensional fluctuation spectra (2DFS) are shown in the third and fourth rows. For PSR B1133+16, the 2DFS plots are shown separately corresponding to the two components of the average pulse profile. The panels on the left and bottom of the LRFS and 2DFS images contain the vertically and horizontally integrated spectra, respectively.
Current usage metrics show cumulative count of Article Views (full-text article views including HTML views, PDF and ePub downloads, according to the available data) and Abstracts Views on Vision4Press platform.
Data correspond to usage on the plateform after 2015. The current usage metrics is available 48-96 hours after online publication and is updated daily on week days.
Initial download of the metrics may take a while.