Fig. 7
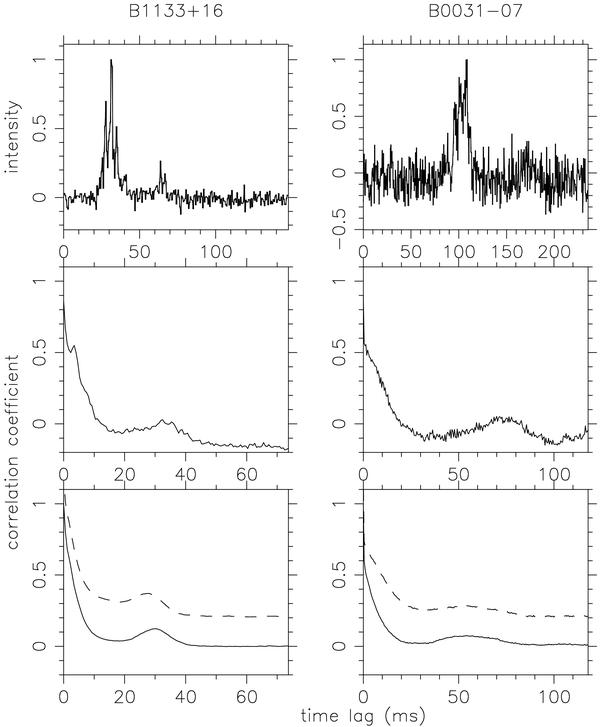
Intensity autocorrelation functions (ACF) of pulses with structure for two pulsars. The uppermost panels present example pulses. The autocorrelations displayed in the middle panel correspond to the pulses above them. The two bottom panels display the averaged ACFs for 120 and 132 pulses for PSRs B0031−07 and B1133+16 respectively. The averaged ACF’s for two bands centred on 116.75 MHz and 173.25 MHz (dashed line) are shown.
Current usage metrics show cumulative count of Article Views (full-text article views including HTML views, PDF and ePub downloads, according to the available data) and Abstracts Views on Vision4Press platform.
Data correspond to usage on the plateform after 2015. The current usage metrics is available 48-96 hours after online publication and is updated daily on week days.
Initial download of the metrics may take a while.