Fig. 5
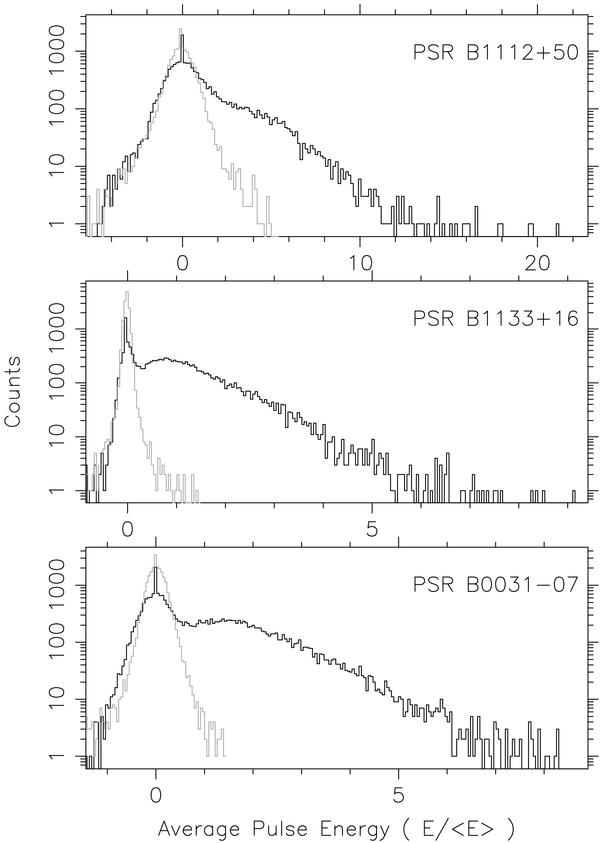
Pulse energy distribution for the three pulsars. The abscissa shows pulse energy normalised to the mean pulse energy. Dark and light grey lines correspond to the on-pulse and off-pulse energy distributions. The clear peak at zero energy is introduced by the RFI affected pulses replaced by zeros.
Current usage metrics show cumulative count of Article Views (full-text article views including HTML views, PDF and ePub downloads, according to the available data) and Abstracts Views on Vision4Press platform.
Data correspond to usage on the plateform after 2015. The current usage metrics is available 48-96 hours after online publication and is updated daily on week days.
Initial download of the metrics may take a while.