Fig. 4
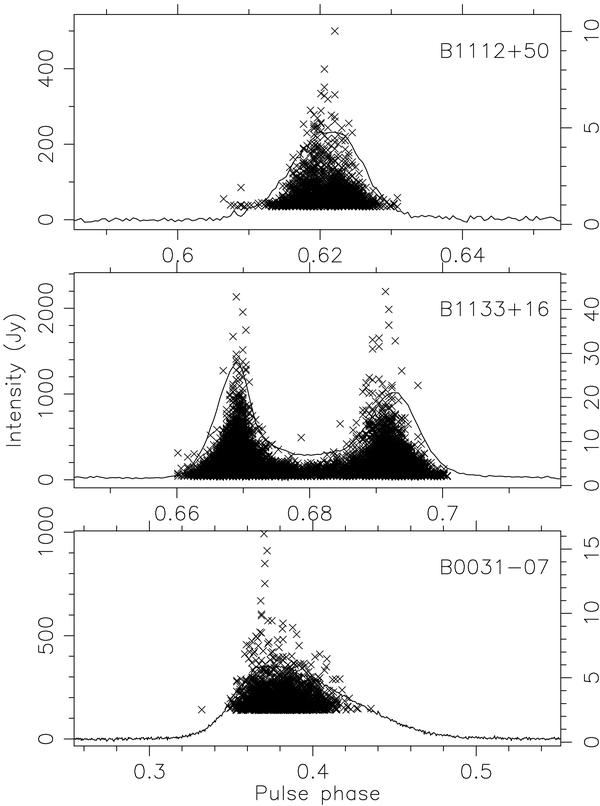
Single bright pulses and the integrated pulse profiles at 156 MHz for the three pulsars. The flux scale on the left ordinate corresponds to the peak flux of the single pulses and the scale on the right ordinate axis corresponds to the average pulse profile. The phase displayed here is different from that of Fig. 3 due to the signal being dedispered to a different central frequency. Peak flux densities of the single pulses are shown as crosses. Only pulses ≥20σ are shown in these plots which represent a low flux cut-off in the fluxes of single pulses.
Current usage metrics show cumulative count of Article Views (full-text article views including HTML views, PDF and ePub downloads, according to the available data) and Abstracts Views on Vision4Press platform.
Data correspond to usage on the plateform after 2015. The current usage metrics is available 48-96 hours after online publication and is updated daily on week days.
Initial download of the metrics may take a while.