Fig. 3
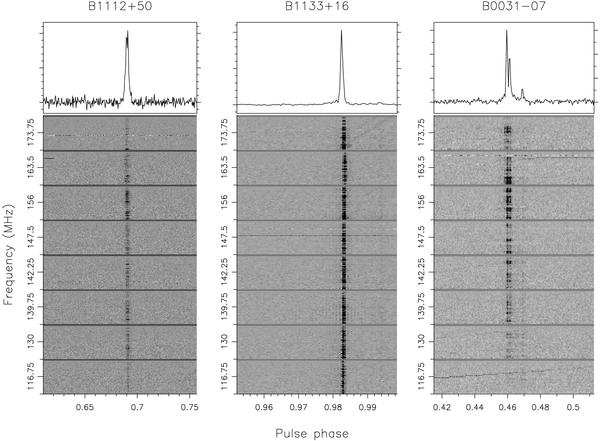
Narrow bright pulses from the three pulsars detected at all eight sky frequencies. The total intensity displayed in the top panels is computed by summing the signal in the 8 bands. The lower panels show a dedispersed pulse as a frequency-phase plot. The abscissa in these plots correspond to the pulse phase at 116.75 MHz. Some residual RFI is visible as low-level intensity modulating the entire pulse phase in the frequency-phase plots of all three pulsars.
Current usage metrics show cumulative count of Article Views (full-text article views including HTML views, PDF and ePub downloads, according to the available data) and Abstracts Views on Vision4Press platform.
Data correspond to usage on the plateform after 2015. The current usage metrics is available 48-96 hours after online publication and is updated daily on week days.
Initial download of the metrics may take a while.