Fig. 2
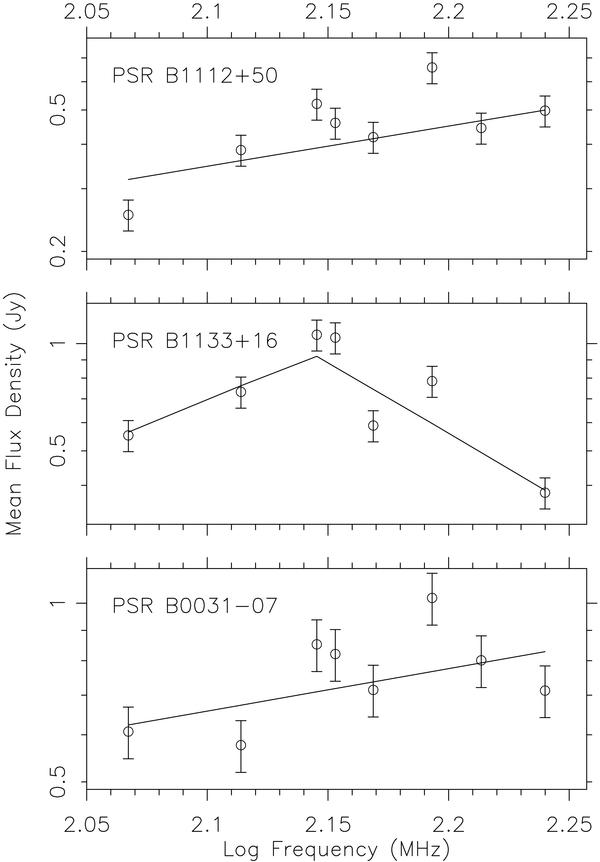
Spectra for three pulsars in the frequency range 100−200 MHz. Errors bars correspond to a 10% uncertainty in the pulsar flux estimation. The best fit power law curves are also displayed. For PSR B1133+16, a broken power-law provides a closer fit to the measured fluxes. The flux in the RFI-affected band centred at 163.5 MHz is not included for PSR B1133+16.
Current usage metrics show cumulative count of Article Views (full-text article views including HTML views, PDF and ePub downloads, according to the available data) and Abstracts Views on Vision4Press platform.
Data correspond to usage on the plateform after 2015. The current usage metrics is available 48-96 hours after online publication and is updated daily on week days.
Initial download of the metrics may take a while.