Fig. 1
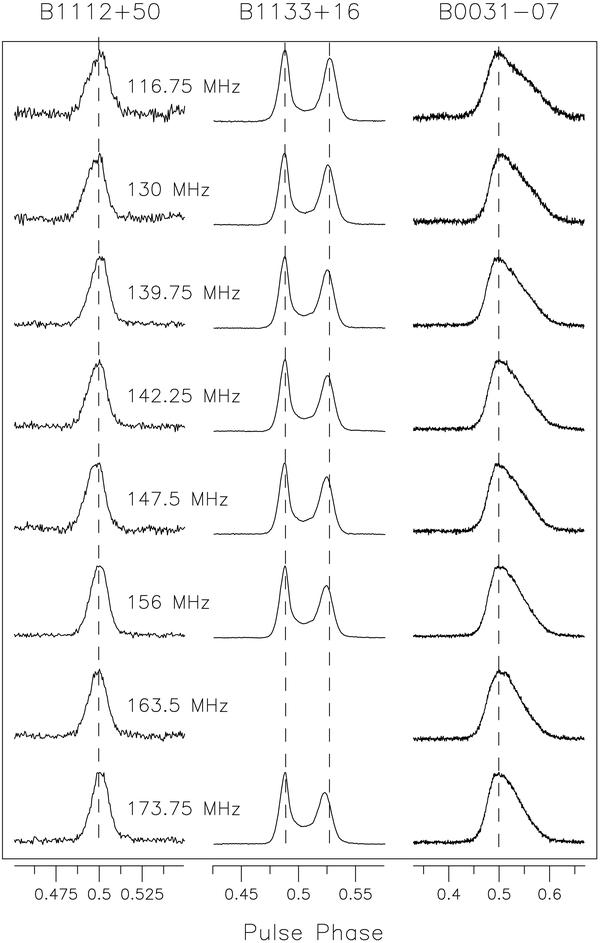
Average pulse profiles of the three pulsars. The profile changes with sky frequency is clearly evident. The profile for PSR B1133+16 at 163.5 MHz is not shown because it was too corrupted by RFI. The profiles are shown at 809, 580, 460 μs time resolution for PSRs B1112+50, B1133+16 and B0031−07 respectively. All profiles are normalised by the maximum flux density in the band and are aligned at the phase of maximum intensity in each band. Profiles at 116.75 and 130 MHz have comparatively more noise because up to ~15% of pulses were removed to reject RFI.
Current usage metrics show cumulative count of Article Views (full-text article views including HTML views, PDF and ePub downloads, according to the available data) and Abstracts Views on Vision4Press platform.
Data correspond to usage on the plateform after 2015. The current usage metrics is available 48-96 hours after online publication and is updated daily on week days.
Initial download of the metrics may take a while.