Fig. 5
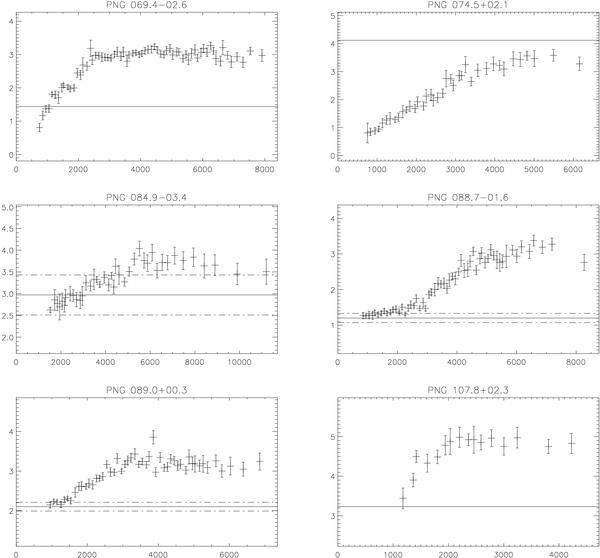
Extinction-distance curves for the second group of six nebulae presented in Table 1. For all graphics, the abscissae are in pc, the ordinates, in visual magnitudes. The horizontal lines represent the visual extinctions corresponding to the nebulae considered in the text. The short dash-long dash lines represent the 1-σ error associated with our Av measurement presented in Table 1.
Current usage metrics show cumulative count of Article Views (full-text article views including HTML views, PDF and ePub downloads, according to the available data) and Abstracts Views on Vision4Press platform.
Data correspond to usage on the plateform after 2015. The current usage metrics is available 48-96 hours after online publication and is updated daily on week days.
Initial download of the metrics may take a while.