Fig. 2
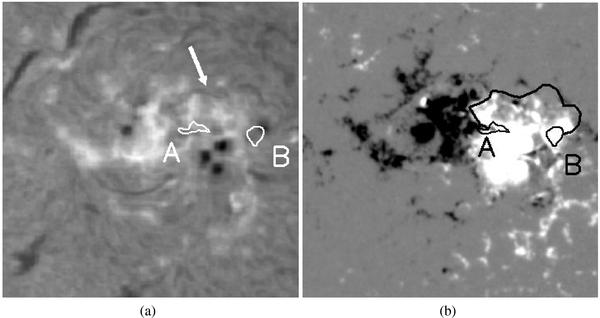
a) Hα image of NOAA 9682 acquired at INAF-Catania Astrophysical Observatory on Nov. 1 at 10:55 UT. The white arrow indicates the filament involved in the eruption. b) Line-of-sight magnetogram taken by MDI on Nov. 1 at 11:11 UT. The saturation levels are ±300 G. The black line indicates the filament location. The contours A and B correspond to the negative patches of the helicity density at filament footpoints (see also Fig. 6). The field of view is ~280 × 280 Mm2 and is corrected for the projection effects by applying a standard differential rotation rate (Howard et al. 1990). North is at the top and west to the right.
Current usage metrics show cumulative count of Article Views (full-text article views including HTML views, PDF and ePub downloads, according to the available data) and Abstracts Views on Vision4Press platform.
Data correspond to usage on the plateform after 2015. The current usage metrics is available 48-96 hours after online publication and is updated daily on week days.
Initial download of the metrics may take a while.