Fig. 8
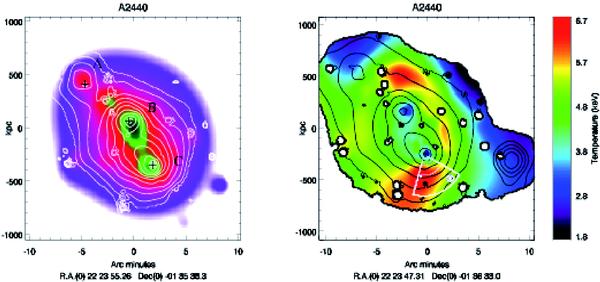
A2440: left: galaxy density map (mag. cuts: R < 19) overlaid on the X-ray luminosity contours (EPIC-XMM counts in the .5−2.5 keV band corrected for background and vignetting). Black crosses indicate the BCG positions. Right: ICM temperature map overlaid on the X-ray luminosity contours (EPIC-XMM data analyzed through wavelet spectral-imaging, see Bourdin et al. 2004, 2008, for details).
Current usage metrics show cumulative count of Article Views (full-text article views including HTML views, PDF and ePub downloads, according to the available data) and Abstracts Views on Vision4Press platform.
Data correspond to usage on the plateform after 2015. The current usage metrics is available 48-96 hours after online publication and is updated daily on week days.
Initial download of the metrics may take a while.