Fig. 3
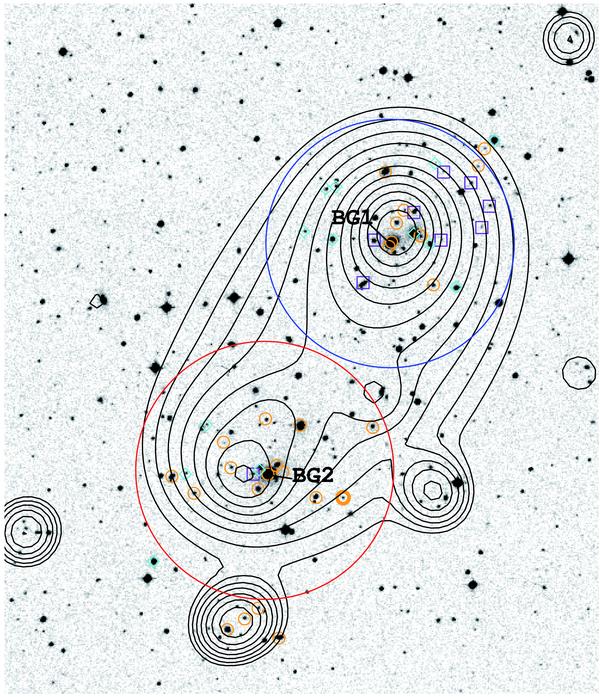
DSS region (17′ × 20′) centered on A2933 (North is up and East is to the left). Galaxies identified as cluster members from spectroscopy are marked with different symbols corresponding to the three major peaks in the velocity histogram (purple squares: [26 000, 26 500] km s-1, cyan diamonds: [26 500, 27 200] km s-1, orange circles: [27 200, 28 500] km s-1) which is plotted in Fig. 4. The isocontours corresponding to the galaxy density map with R < 19 are superimposed. The velocity histograms for the galaxies in the two circles (which have a 3.5 arcmin radius and are centered on the two subclusters) are displayed in Fig. 5.
Current usage metrics show cumulative count of Article Views (full-text article views including HTML views, PDF and ePub downloads, according to the available data) and Abstracts Views on Vision4Press platform.
Data correspond to usage on the plateform after 2015. The current usage metrics is available 48-96 hours after online publication and is updated daily on week days.
Initial download of the metrics may take a while.