Free Access
Fig. 18
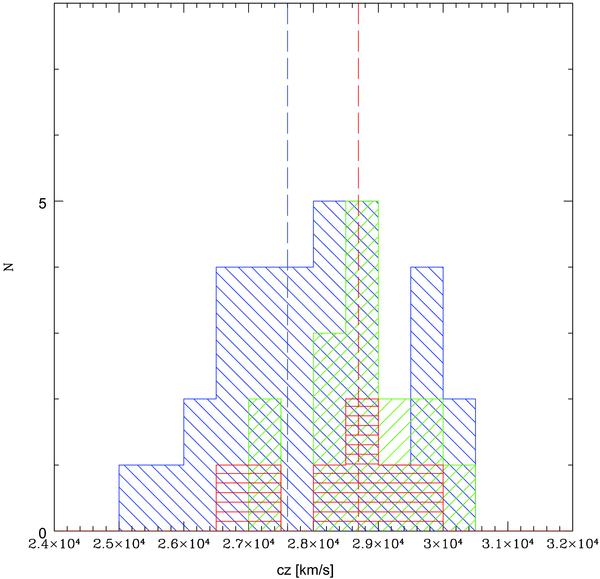
Velocity histograms of A2384N (blue), the intermediate region (green) and A2384S (red). For each subcluster we included galaxies within a radius of 3′ from its center. Velocity bins of 500 km s-1 are used. Dashed lines: velocities of the brightest galaxies in A2384N (blue) and A2384S (red).
Current usage metrics show cumulative count of Article Views (full-text article views including HTML views, PDF and ePub downloads, according to the available data) and Abstracts Views on Vision4Press platform.
Data correspond to usage on the plateform after 2015. The current usage metrics is available 48-96 hours after online publication and is updated daily on week days.
Initial download of the metrics may take a while.