Fig. 1
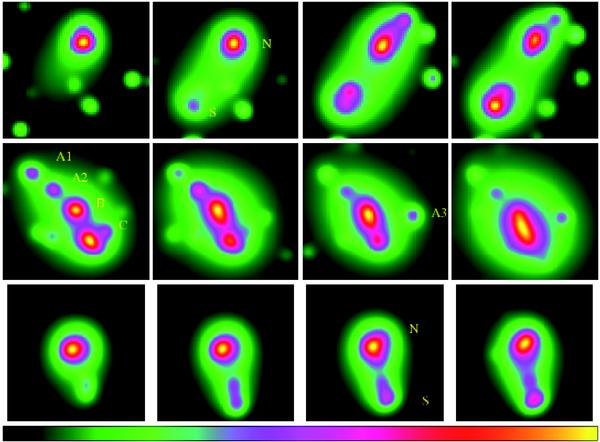
Galaxy density maps as a function of galaxy luminosity. From top to bottom: A2933, A2440 and A2384. The field of view displayed is 15′ × 15′ for A2933 and A2440, and 30′ × 30′ for A2384. From left to right, magnitude cuts are: R < 18, R < 19, R < 20 and R < 21. The density maps of A2440 and A2384 have been computed for red sequence galaxies.
Current usage metrics show cumulative count of Article Views (full-text article views including HTML views, PDF and ePub downloads, according to the available data) and Abstracts Views on Vision4Press platform.
Data correspond to usage on the plateform after 2015. The current usage metrics is available 48-96 hours after online publication and is updated daily on week days.
Initial download of the metrics may take a while.