Fig. 4
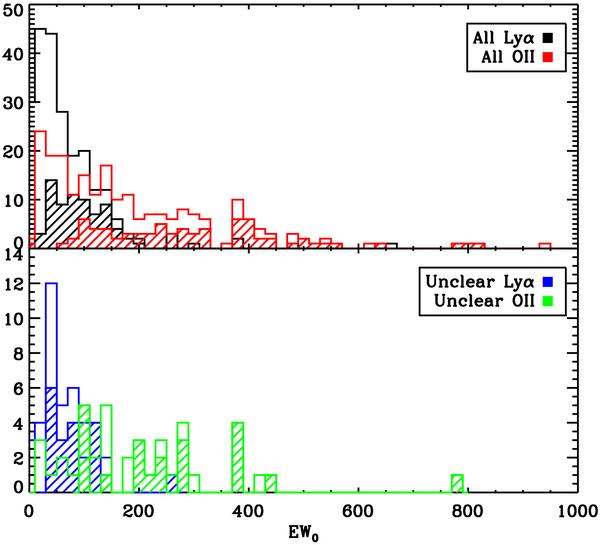
top panel: for the full sample, the distribution of rest-frame EW if the lines are identified as Lyα (black histogram) or as [OII]3727 (red histogram). The filled histograms show objects without a detected continuum, for which the EW is a lower limit. lower panel: the same as the top panel, but for the 49 lines identified as ambiguous. The blue and green histograms represent respectively the rest-frame EW if the lines are identified as Lyα or as [OII]3727.
Current usage metrics show cumulative count of Article Views (full-text article views including HTML views, PDF and ePub downloads, according to the available data) and Abstracts Views on Vision4Press platform.
Data correspond to usage on the plateform after 2015. The current usage metrics is available 48-96 hours after online publication and is updated daily on week days.
Initial download of the metrics may take a while.