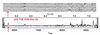
Fig. 2
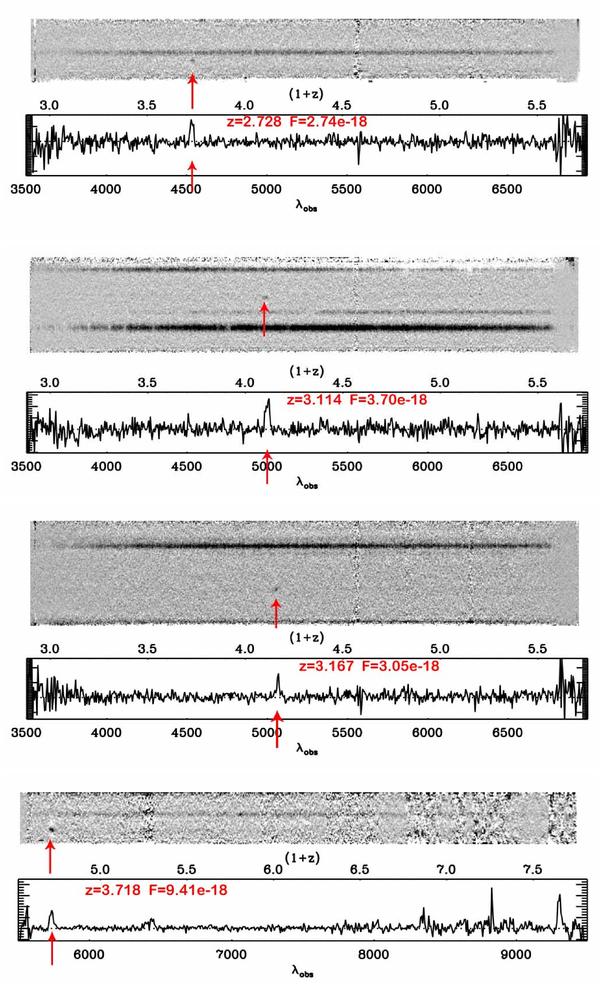
Random selection of LAE candidates from the Ultra-Deep blue dataset, ordered by increasing redshift. For each of them we show the full 2-d (top) and 1-d (bottom) spectra. The position of Lyα is indicated by an arrow on both the 2-d and 1-d spectra, and by a label reporting the redshift on the 1-d spectrum. The observed wavelength scale at the bottom of the 1-d spectrum is transformed into the redshift of Lyα at each wavelength on the top.
Current usage metrics show cumulative count of Article Views (full-text article views including HTML views, PDF and ePub downloads, according to the available data) and Abstracts Views on Vision4Press platform.
Data correspond to usage on the plateform after 2015. The current usage metrics is available 48-96 hours after online publication and is updated daily on week days.
Initial download of the metrics may take a while.