Fig. 9
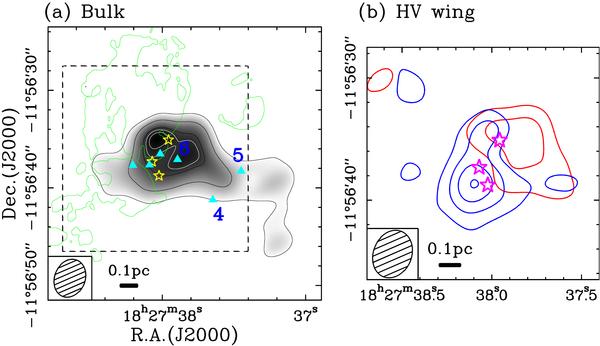
a) Integrated intensity map of the H13CO+ (1−0) bulk emission. The velocity range used for the integration is 35.5 ≤ VLSR/km s-1 ≤ 48.9. The interval between the thin-black contours is 2σ with the lowest contour corresponding to the 3σ level, where the 1σ rms noise is 0.53 Jy beam-1 km s-1. The thin-white contours are the 95% and 90% levels of the corresponding peak intensities, where the 90% levels correspond to the 7.5σ level. All the other symbols are the same as those in Fig. 6, and the numbers associated with the three maser spots to the west are the same as those used by Hofner & Churchwell (1996). The dashed box indicates the area shown in the right-hand panel. b) Overlay of the blue- and redshifted wing emission maps of the H13CO+ (1−0) emission. The contours are 2σ steps starting from the 3σ level. The blue- and redshifted wing emission maps were obtained by averaging the wing emission over the intervals 35.3 < VLSR/km s-1 < 37.9 and 43.1 < VLSR/km s-1 < 49.2, and their rms noise levels are 43.8 and 30.2 mJy beam-1, respectively.
Current usage metrics show cumulative count of Article Views (full-text article views including HTML views, PDF and ePub downloads, according to the available data) and Abstracts Views on Vision4Press platform.
Data correspond to usage on the plateform after 2015. The current usage metrics is available 48-96 hours after online publication and is updated daily on week days.
Initial download of the metrics may take a while.