Fig. 8
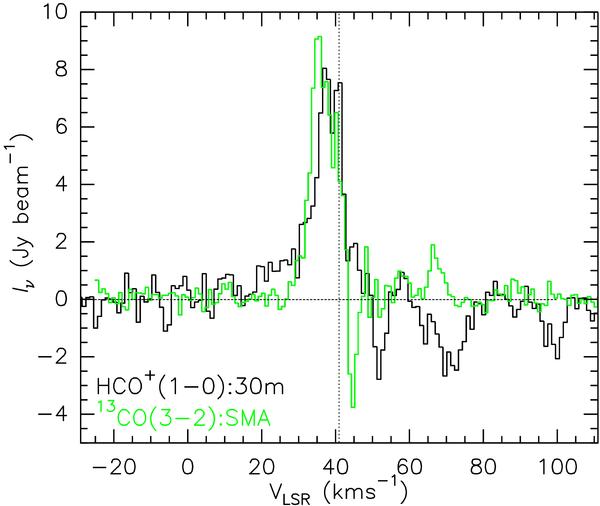
Comparison of the absorption features seen in the 13CO (3−2) and HCO+ (1−0) lines toward the peak of the 890 μm continuum emission. For the sake of comparison, the interferometric 13CO (3−2) spectrum has been obtained after reconstructing the data with a synthesized beam equal to the single-dish beam of the HCO+ line observations with IRAM 30-m telescope (see Sect. 3.3.3).
Current usage metrics show cumulative count of Article Views (full-text article views including HTML views, PDF and ePub downloads, according to the available data) and Abstracts Views on Vision4Press platform.
Data correspond to usage on the plateform after 2015. The current usage metrics is available 48-96 hours after online publication and is updated daily on week days.
Initial download of the metrics may take a while.