Fig. 7
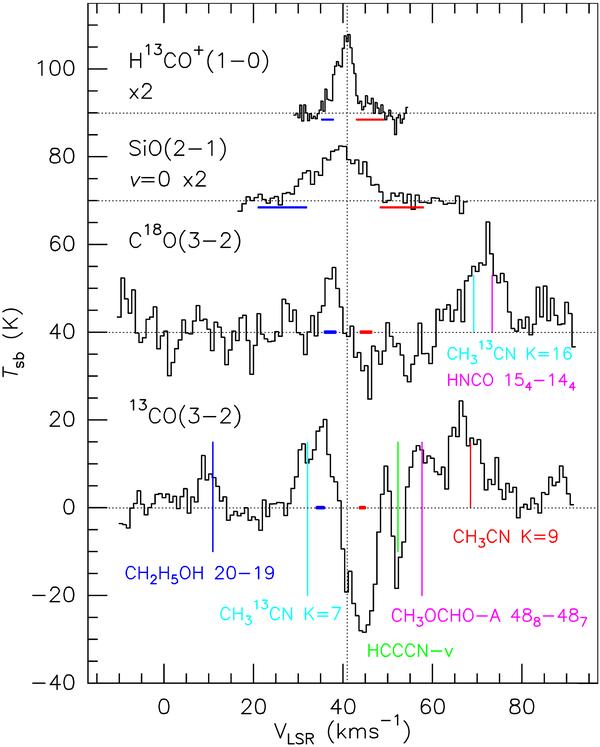
Spectra of four molecular lines in Tsb scale towards the peak of the 890 μm continuum emission, i.e., SMA1. The SiO and H13CO+ intensities are scaled by a factor 2.0. The vertical dashed line indicates the systemic velocity (Vsys) of the cloud, VLSR = 41.6 km s-1. In the CO isotopomers spectra, we mark the positions of all possible (molecular) lines, calculated assuming that they are emitted with velocity equal to Vsys (see Sect. 3.3.2). The thick horizontal blue and red bars denote the velocity intervals over which the line emission has been integrated to produce the maps in Figs. 9, 10, and 16. The emission seen around VLSR ≃ 70 km s-1 of the C18O spectrum probably originates in the HNCO line rather than CH CN 1816 − 1716.
Current usage metrics show cumulative count of Article Views (full-text article views including HTML views, PDF and ePub downloads, according to the available data) and Abstracts Views on Vision4Press platform.
Data correspond to usage on the plateform after 2015. The current usage metrics is available 48-96 hours after online publication and is updated daily on week days.
Initial download of the metrics may take a while.