Fig. 4
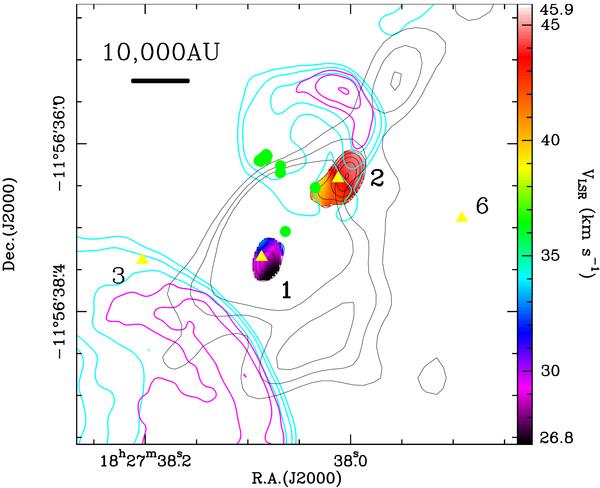
First moment map of the H2O masers (color image) and maps of the continuum emission (color contours). The black contours overlayed on the maser velocity map correspond to the integrated intensity of the maser spots, with levels starting from the 5σ level with 5σ steps. The black, cyan, and magenta contours represent the first 3 contours of the 890 μm, 6 cm, and 3.8 cm continuum emission, respectively (the same as in Fig. 2). The yellow triangles and green-filled circles show, respectively, the positions of the H2O (Hofner & Churchwell 1996) and OH (Garay et al. 1985) masers. The numbers associated with the yellow triangles are used to identify the maser features as done by Hofner & Churchwell (1996).
Current usage metrics show cumulative count of Article Views (full-text article views including HTML views, PDF and ePub downloads, according to the available data) and Abstracts Views on Vision4Press platform.
Data correspond to usage on the plateform after 2015. The current usage metrics is available 48-96 hours after online publication and is updated daily on week days.
Initial download of the metrics may take a while.