Fig. 3
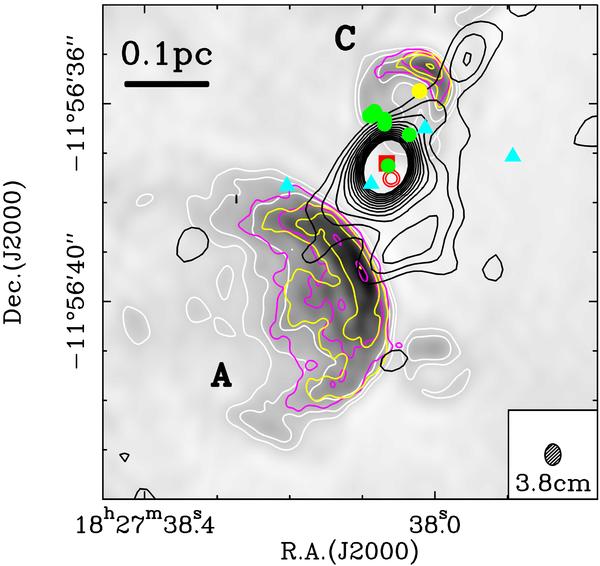
Comparison of the 6 cm (greyscale plus white contour), 3.8 cm (magenta contour), and 1.3 cm (yellow contour) continuum emission maps generated with the common minimum UV distance of 13.3 kλ (see Sect. 3.1.3). Contour intervals for the cm maps and the submm map are the same as those in Figs. 1 and 2, respectively, where the 1σ noise levels are 0.23, 0.18, and 0.36 mJy beam-1 and the beams 0''̣433 × 0''̣321, 0''̣262 × 0''̣195, and 0''̣344 × 0''̣251, for the 6.0, 3.8, and 1.3 cm maps, respectively. The largest of the three beams is shown in the bottom right. The filled red rectangules and the double red circles indicate the peak positions of the 3 mm (Paper I) and 890 μm (Sect. 3.1.2) continuum emission, respectively. The filled green circles and light-blue triangles show the positions of the OH (Garay et al. 1985) and H2O (Hofner & Churchwell 1996) masers, respectively. Labels A and C refer to the UC HII regions (notation as in Paper I and references therein). The filled yellow circle associated with the UC HII region C indicates the peak position of the isolated 7 mm emission seen in Fig. 1e close to the HMC.
Current usage metrics show cumulative count of Article Views (full-text article views including HTML views, PDF and ePub downloads, according to the available data) and Abstracts Views on Vision4Press platform.
Data correspond to usage on the plateform after 2015. The current usage metrics is available 48-96 hours after online publication and is updated daily on week days.
Initial download of the metrics may take a while.