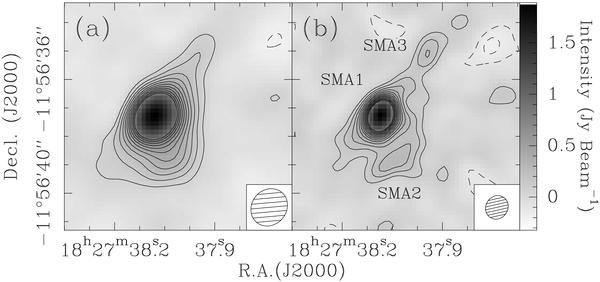
Fig. 2

Continuum emission maps at 890 μm taken with SMA toward G 19.61−0.23 with a) natural weighting and b) uniform weighting. The solid contours start at the 3σ level and increase in steps of + 2σ up to the 50% level for a clarity of the maps. The dashed contours start at the −3σ level and decrease in steps of −2σ. The image noise levels are 54.1 and 34.9 mJy beam-1 for panels a) and b), respectively. The sensitivity of the uniformly weighted map is better than that of the naturally weighted map, probably because the visibilities have not been weighted taking into account the system temperature of each antenna (see Sect. 2.5). The synthesized beams are shown in the bottom right corners (1''̣38 × 1''̣22 with PA = −44° for natural weighting; 0''̣85 × 0''̣78 with PA = −32° for uniform weighting).
Current usage metrics show cumulative count of Article Views (full-text article views including HTML views, PDF and ePub downloads, according to the available data) and Abstracts Views on Vision4Press platform.
Data correspond to usage on the plateform after 2015. The current usage metrics is available 48-96 hours after online publication and is updated daily on week days.
Initial download of the metrics may take a while.


