Fig. 16
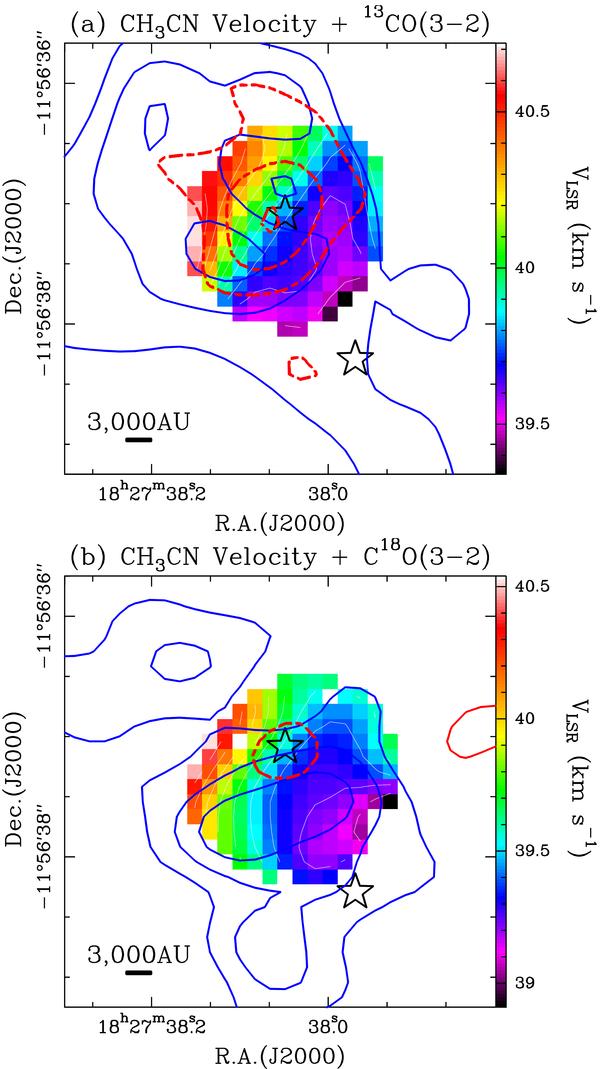
The color maps are the same as in Fig. 14, while the superimposed solid blue and dashed red contours represent, respectively, the blueshifted emission and redshifted absorption seen in the 13CO (left panel) and C18O (right panel). To obtain these plots, we integrated the line over 3 velocity channels centered on the deepest absorption and the most intense emission, namely over the ranges: 34.2 ≤ VLSR/km s-1 ≤ 35.8 for the blueshifted 13CO emission, 43.8 ≤ VLSR/km s-1 ≤ 45.0 for the redshifted 13CO absorption, and 36.0 ≤ VLSR/km s-1 ≤ 38.4 for the blueshifted C18O emission, 44.0 ≤ VLSR/km s-1 ≤ 46.4 for the redshifted C18O absorption. These velocity ranges are outlined by the horizontal blue and red bars in Fig. 7. All the contours are in steps of ± 2σ and start from the ± 3σ level. The stars mark the peak positions of SMA1 and SMA2. See Sect. 4.2 for details.
Current usage metrics show cumulative count of Article Views (full-text article views including HTML views, PDF and ePub downloads, according to the available data) and Abstracts Views on Vision4Press platform.
Data correspond to usage on the plateform after 2015. The current usage metrics is available 48-96 hours after online publication and is updated daily on week days.
Initial download of the metrics may take a while.