Fig. 15
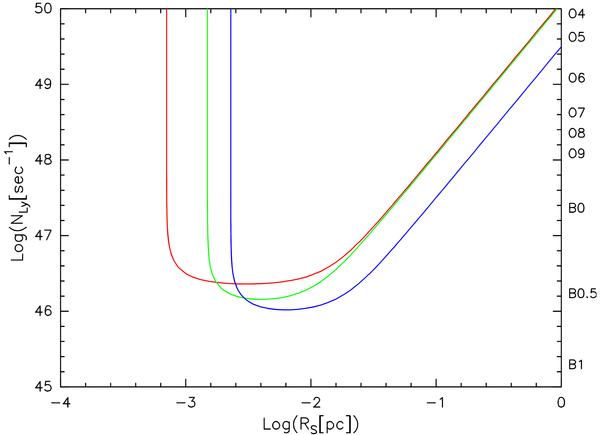
Plot of the brightness temperature in the synthesized beam of a Strömgren HII region, as a function of radius and Lyman continuum photon rate (see Sect. 4.1 for details). The curves correspond to the 3σ upper limits on the free-free continuum emission measured towards SMA1 at 4.86 GHz (blue), 8.42 GHz (green), and 22.273 GHz (red). Here the rms noise levels and the geometrical mean of the beam FWHPs adopted to plot are 230 μJy beam-1 at 5 GHz, 180 μJy beam-1 at 8 GHz, and 360 μJy beam-1 at 22 GHz. The labels to the right indicate the spectral types of the ZAMS stars with the corresponding value of NLy, according to Panagia (1973).
Current usage metrics show cumulative count of Article Views (full-text article views including HTML views, PDF and ePub downloads, according to the available data) and Abstracts Views on Vision4Press platform.
Data correspond to usage on the plateform after 2015. The current usage metrics is available 48-96 hours after online publication and is updated daily on week days.
Initial download of the metrics may take a while.