Fig. 12
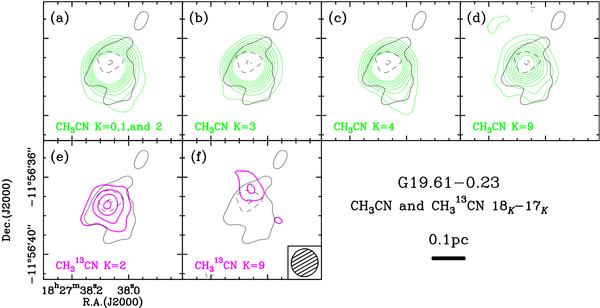
Integrated intensity maps of the JK = 18K − 17K emission of the CH3CN (green contour) and CH313CN (magenta contour) lines. The black dashed contour corresponds to the absorptions region seen in the 13CO (3−2) line. The thin black contour represents the 7σ level of the uniform weighting 890 μm continuum emission map (Fig. 2b). All the transitions, except the CH3CN K = 0, 1, and 2 components, are not blended with other lines (see Fig. 11 for the spectrum). The contour intervals are spaced by 2σ and start from the 3σ level. In the CH3CN maps, we do not plot contours above the 17σ level to prevent saturation of the maps. The 1σ rms noise levels are 6.3, 1.4, 1.3, 0.33, and 0.17 mJy beam-1 km s-1 for the CH3CN (18−17) K = 0 to 2 emission, K = 3, K = 4, and CH313CN (18−17) K = 2, and K = 6, respectively.
Current usage metrics show cumulative count of Article Views (full-text article views including HTML views, PDF and ePub downloads, according to the available data) and Abstracts Views on Vision4Press platform.
Data correspond to usage on the plateform after 2015. The current usage metrics is available 48-96 hours after online publication and is updated daily on week days.
Initial download of the metrics may take a while.