Fig. 11
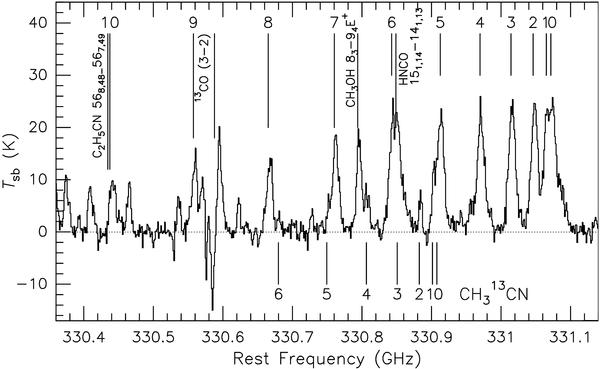
Interferometric spectrum of the CH3CN and CH313CN (18−17) lines towards the peak position of the 890 μm continuum source, SMA1. The vertical bars above and below the spectrum indicate the rest-frequencies of the K components of the CH3CN and CH313CN J = 18−17 transitions. We also indicate other lines that may be blended with the methyl cyanide lines.
Current usage metrics show cumulative count of Article Views (full-text article views including HTML views, PDF and ePub downloads, according to the available data) and Abstracts Views on Vision4Press platform.
Data correspond to usage on the plateform after 2015. The current usage metrics is available 48-96 hours after online publication and is updated daily on week days.
Initial download of the metrics may take a while.