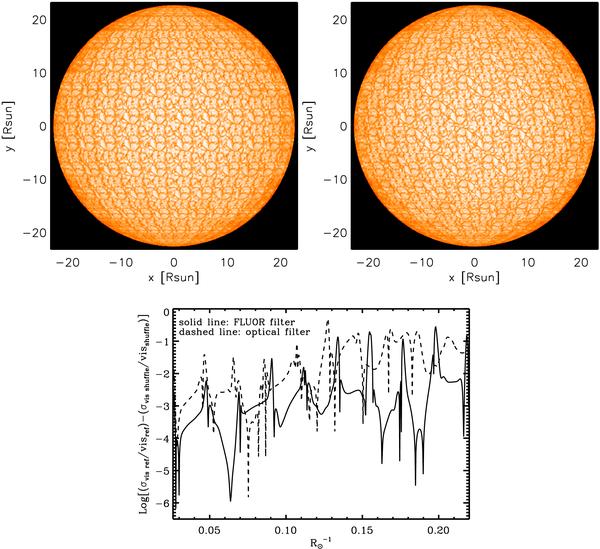
Fig. 8

Top left panel: synthetic stellar disk image in the FLUOR filter for the simulation with [Fe/H ] = −3.0 and log g = 1.6 tiled using only one intensity map at different μ-angles (see text for details). The granulation pattern is continuous. The intensity range is [5000, 0.11 × 10⁶] erg cm-2 s-1 Å-1. Top right panel: synthetic stellar disk image in the same filter and using the same intensity map but flipping the y-axis every second tile to remove the periodicity at the side of each box. Bottom panel: ratio of the fluctuations of the synthetic visibility curves derived from the above images: σref/visref refers to top left panel and σshuffle/visshuffle to top right panel.
Current usage metrics show cumulative count of Article Views (full-text article views including HTML views, PDF and ePub downloads, according to the available data) and Abstracts Views on Vision4Press platform.
Data correspond to usage on the plateform after 2015. The current usage metrics is available 48-96 hours after online publication and is updated daily on week days.
Initial download of the metrics may take a while.


