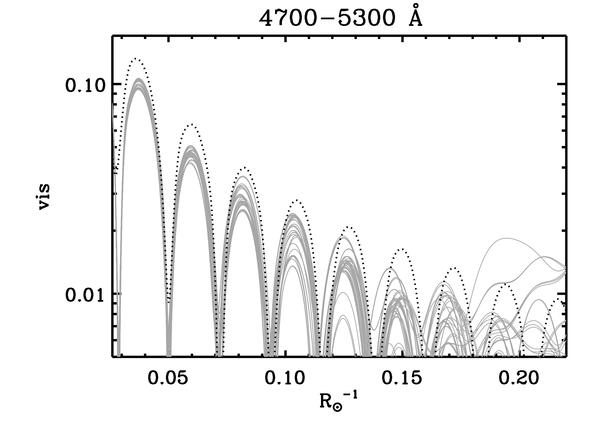
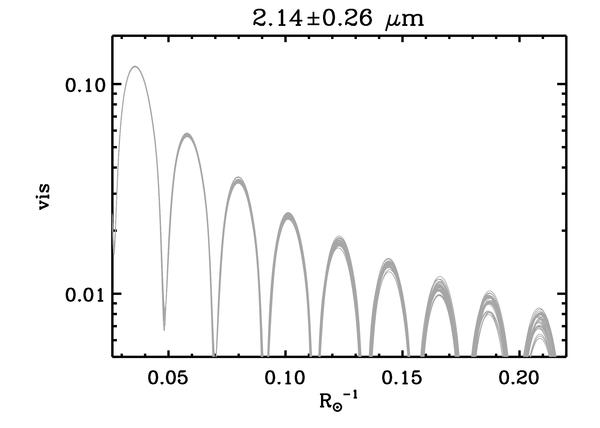
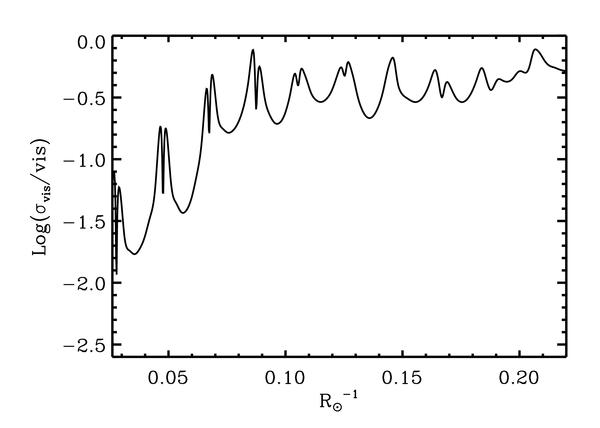
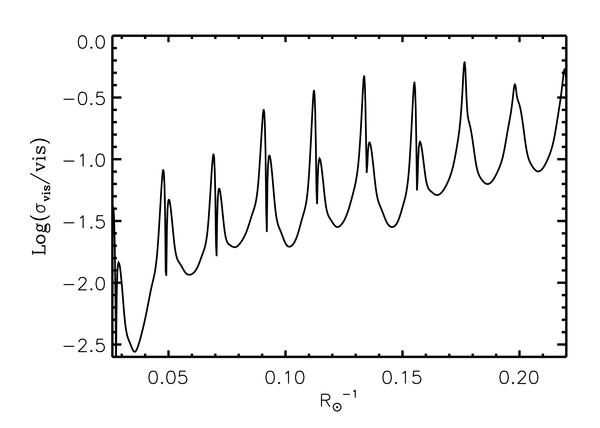
Fig. 7
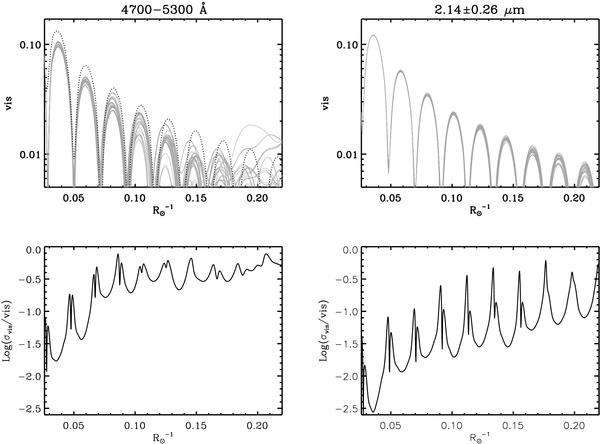
Top row: visibility curves from the RHD simulation with [Fe/H ] = −3.0 and log g = 1.6 in the optical (left column) and infrared (right column) filters. The visibilities are computed for 36 different azimuth angles 5° apart (thin gray lines). The dotted line is an uniform disk scaled to match the same radius, i.e. the first null in visibility curve. The visibilities are displayed only longward of the first null visibility point (see text). A logarithm scale is used on y-axis. Bottom row: visibility fluctuations with respect to the average value as a function of spatial frequencies.


Current usage metrics show cumulative count of Article Views (full-text article views including HTML views, PDF and ePub downloads, according to the available data) and Abstracts Views on Vision4Press platform.
Data correspond to usage on the plateform after 2015. The current usage metrics is available 48-96 hours after online publication and is updated daily on week days.
Initial download of the metrics may take a while.