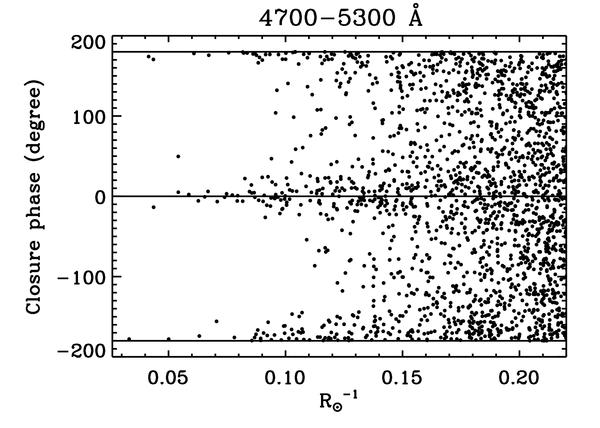
Fig. 12
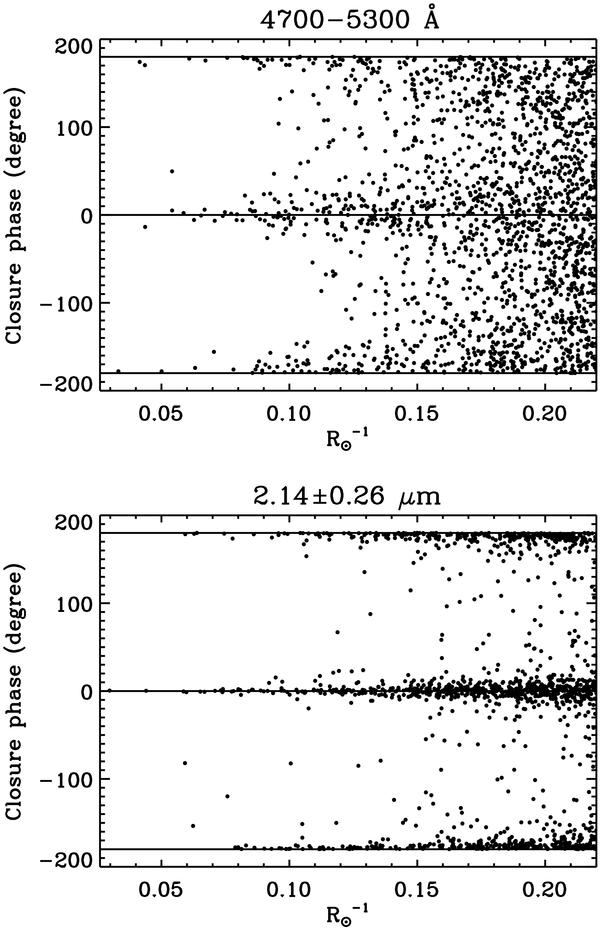
Scatter plot of closure phases of 2000 random baseline triangles for RHD simulation with [Fe/H ] = −3.0 and log g = 1.6 with a maximum linear extension of ~510 m at 0.5 μm and ~2200 m at 2.14 μm and for a star at 100 pc. The extension of the baselines has been expressed in  using Eqs. (2) and (3). The axisymmetric case is represented by the straigth lines.
Current usage metrics show cumulative count of Article Views (full-text article views including HTML views, PDF and ePub downloads, according to the available data) and Abstracts Views on Vision4Press platform.
Data correspond to usage on the plateform after 2015. The current usage metrics is available 48-96 hours after online publication and is updated daily on week days.
Initial download of the metrics may take a while.