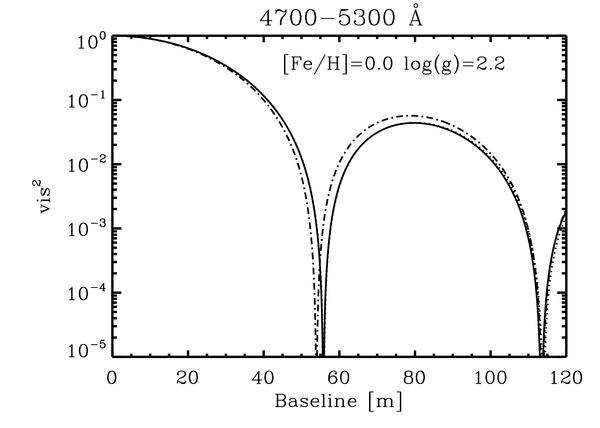
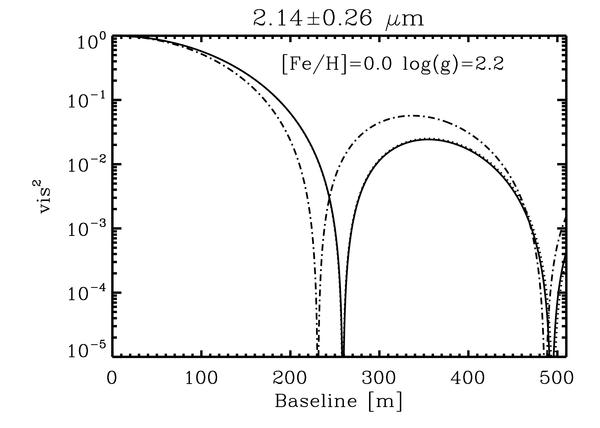
Fig. 11
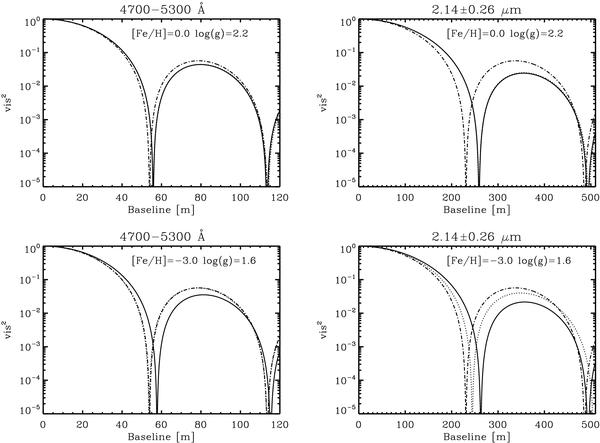
Visibility curves computed with Eq. (5) for and angular diameter of 2 mas and for the 3D (solid line), 1D (dotted line), and fully limb darkening (dash-dotted line) intensity profiles of Fig. 6. In top panels, the dotted and solid lines are almost overlying, while in bottom left panel the dotted line is almost overlying the dash-dotted one. A logarithm scale is used on y-axis. Synthetic visibilities in these plots are not realistic near the nulls but are intended only for model-to-model comparison.

Current usage metrics show cumulative count of Article Views (full-text article views including HTML views, PDF and ePub downloads, according to the available data) and Abstracts Views on Vision4Press platform.
Data correspond to usage on the plateform after 2015. The current usage metrics is available 48-96 hours after online publication and is updated daily on week days.
Initial download of the metrics may take a while.