Fig. 9
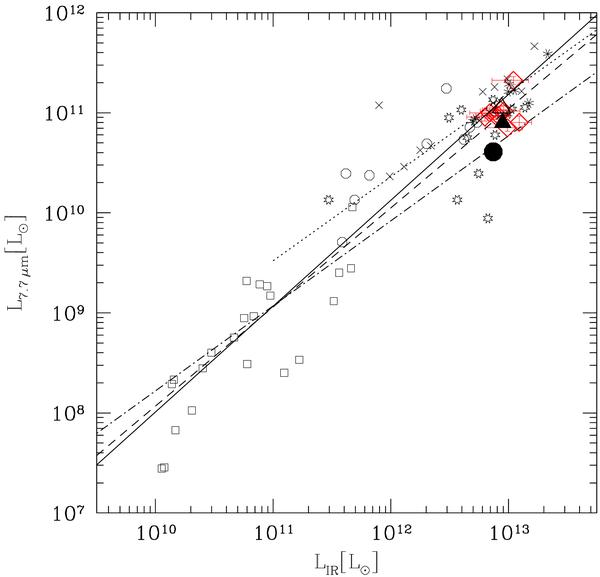
L7.7 μm as a function of LIR. The symbols are the same as in Fig. 6. The solid line is our best fit to all samples. The dashed line is the best fit found by Pope et al. (2008) from fitting both their SMGs and the local starbursts. The dotted line is the best fit found by Shi et al. (2009). The dot-dashed line is the best fit found by Menéndez-Delmestre et al. (2009).
Current usage metrics show cumulative count of Article Views (full-text article views including HTML views, PDF and ePub downloads, according to the available data) and Abstracts Views on Vision4Press platform.
Data correspond to usage on the plateform after 2015. The current usage metrics is available 48-96 hours after online publication and is updated daily on week days.
Initial download of the metrics may take a while.