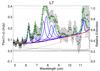
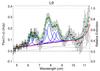
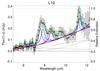
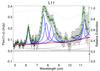
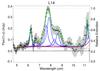
Fig. B.1
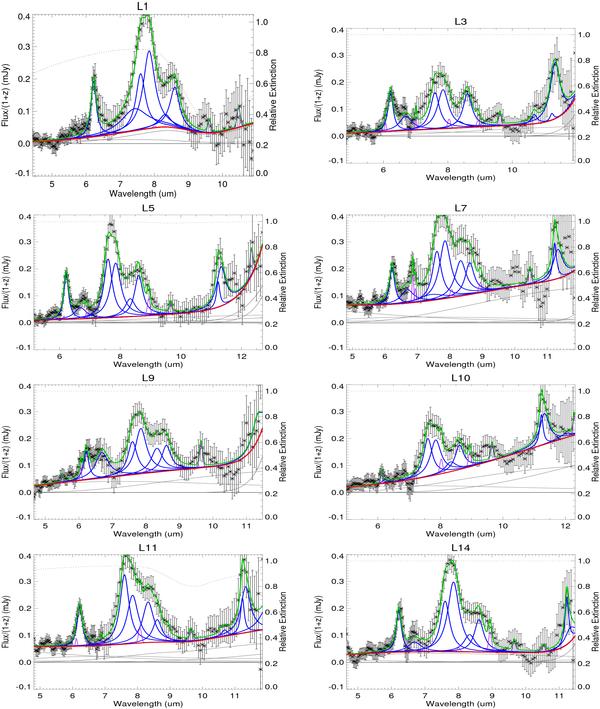
Decompositions of the spectra of our sources. The solid green line is the fitted model. The blue lines above the continuum are the PAH features. The violet lines are the spectral lines. The thin grey lines represent the thermal dust continuum components. The thick red line shows the total continuum (stars+dust). The dotted black line shows the extinction (e−τλ, = 1 if no extinction). The source ID is reported as the title of each panel.
Current usage metrics show cumulative count of Article Views (full-text article views including HTML views, PDF and ePub downloads, according to the available data) and Abstracts Views on Vision4Press platform.
Data correspond to usage on the plateform after 2015. The current usage metrics is available 48-96 hours after online publication and is updated daily on week days.
Initial download of the metrics may take a while.