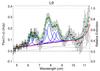
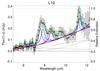
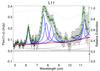
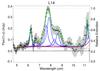
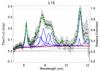
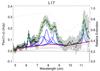
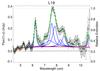
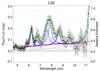
Fig. A.1
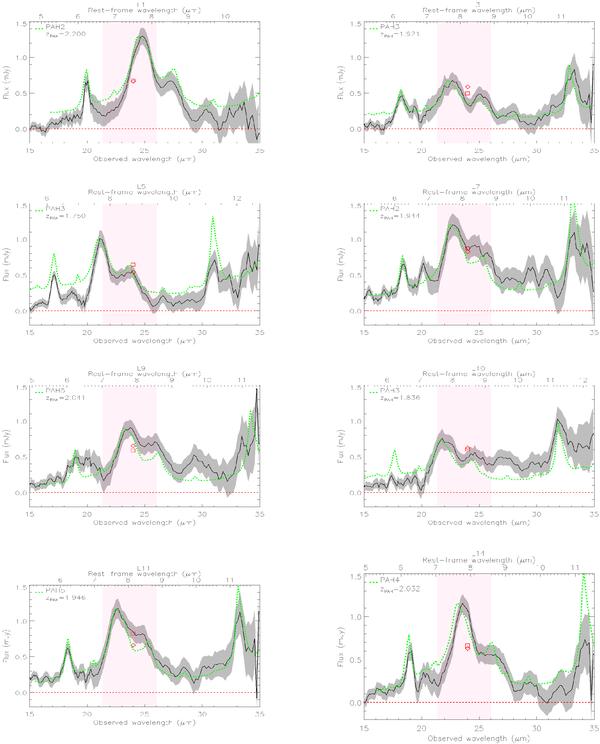
IRS spectra of our sources. The black line is our data. In shaded grey, we plot the 1σ deviation. The green short-dashed line is the best-fit PAH template from Smith et al. (2007). The red diamond is the 24 μm flux density from the SWIRE catalogue. The red square is the 24 μm flux density extracted from the spectrum with the 24 μm filter profile. The pink shape shows the region where the transmission of the 24 μm is maximum. All these spectra are plotted in observed wavelength. The templates are scaled to the “(1 + z) × 7.7 μm” flux. The source ID, the names of the best-fit templates, and zPAH are reported in each panel.
Current usage metrics show cumulative count of Article Views (full-text article views including HTML views, PDF and ePub downloads, according to the available data) and Abstracts Views on Vision4Press platform.
Data correspond to usage on the plateform after 2015. The current usage metrics is available 48-96 hours after online publication and is updated daily on week days.
Initial download of the metrics may take a while.