Fig. 13
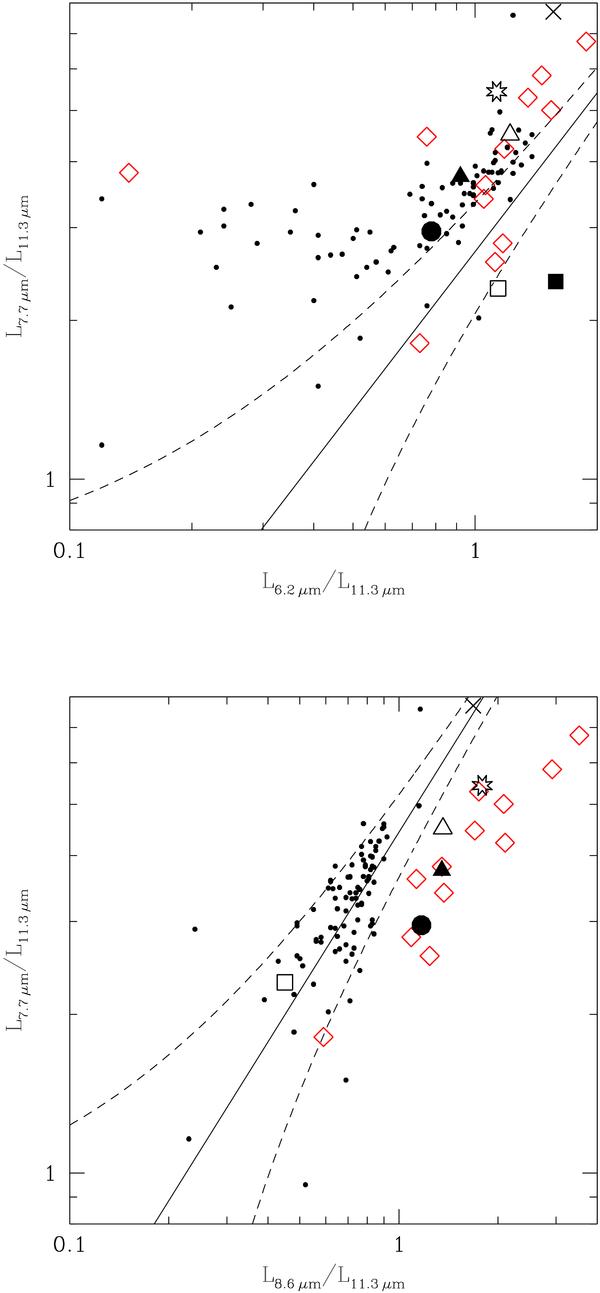
Upper panel: L7.7 μm/L11.3 μm as a function of L6.2 μm/L11.3 μm. Lower panel: L7.7 μm/L11.3 μm as a function of L8.6 μm/L11.3 μm. In both panels, the red diamonds are the sources in our sample. The small black circles are the sample of O’Dowd et al. (2009). The open (full) black triangle is the stack of our sources with EW7.7 μm > (< )6 μm. The black cross shows the average for the PAH-rich sources from Sajina et al. (2007). The black star shows the average for the sample of SMGs from Pope et al. (2008). The open black square shows the average for the local star-forming galaxies from Brandl et al. (2006). The full black square is the average for the sample of “4.5 μm-peakers” from Farrah et al. (2008). The large black circle is based on the composite spectrum of the SMG sample from Menéndez-Delmestre et al. (2009). The black line and the dotted lines are the best linear regression and the 1σ dispersion found by Galliano et al. (2008) for Galactic HII regions, dwarf spirals, and starburst galaxies.
Current usage metrics show cumulative count of Article Views (full-text article views including HTML views, PDF and ePub downloads, according to the available data) and Abstracts Views on Vision4Press platform.
Data correspond to usage on the plateform after 2015. The current usage metrics is available 48-96 hours after online publication and is updated daily on week days.
Initial download of the metrics may take a while.