Fig. 12
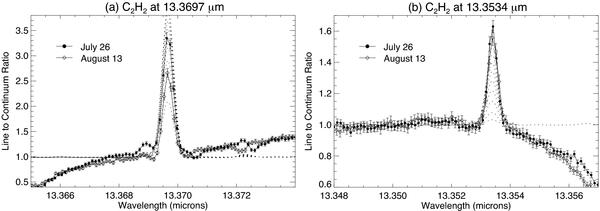
Observations of two C2H2 lines from VLT/VISIR on July 26 (dots) and August 13 (diamonds). As absolute calibration proved difficult for these spectra, the plots are expressed as a line-to-continuum ratio, with the continuum defined by a mean of the uncalibrated flux either side of the emission features. The “dip” of the continuum is an artefact of poorly-corrected telluric absorption. Models of the expected ratio, based on scaling the C2H2 profiles of Nixon et al. (2007), are shown as dotted lines for comparison. The same models were used for panels a) and b), indicating the difficulty in determining a unique profile of C2H2 from this dataset.
Current usage metrics show cumulative count of Article Views (full-text article views including HTML views, PDF and ePub downloads, according to the available data) and Abstracts Views on Vision4Press platform.
Data correspond to usage on the plateform after 2015. The current usage metrics is available 48-96 hours after online publication and is updated daily on week days.
Initial download of the metrics may take a while.