Fig. 10
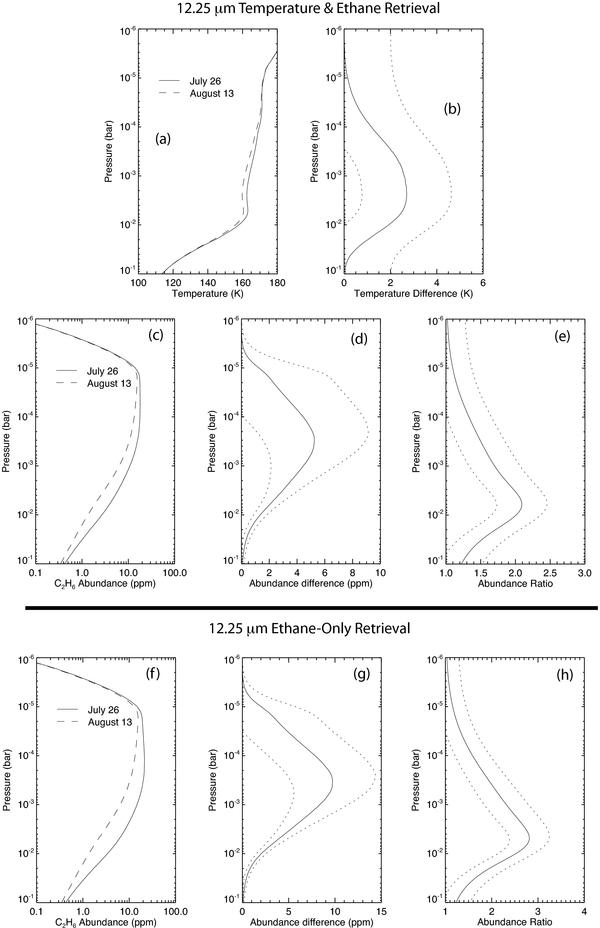
Profiles of temperature and ethane derived from models of VLT/VISIR 12.25 μm spectroscopy of the impact site. Two different techniques for fitting the data were attempted. In the upper panels we fit the data by varying T(p) (a)−b)) and the C2H6 abundances simultaneously (c)−e)). In the lower panels we fit the data by varying C2H6 alone (f)−h)). In all cases, the solid lines are results for July 26, the dashed lines are results for August 13. The dotted lines show the formal retrieval error on the vertical profiles, though these are omitted from panels a, c and f for clarity. An enhancement of ethane is required in both scenarios.
Current usage metrics show cumulative count of Article Views (full-text article views including HTML views, PDF and ePub downloads, according to the available data) and Abstracts Views on Vision4Press platform.
Data correspond to usage on the plateform after 2015. The current usage metrics is available 48-96 hours after online publication and is updated daily on week days.
Initial download of the metrics may take a while.