Fig. 11
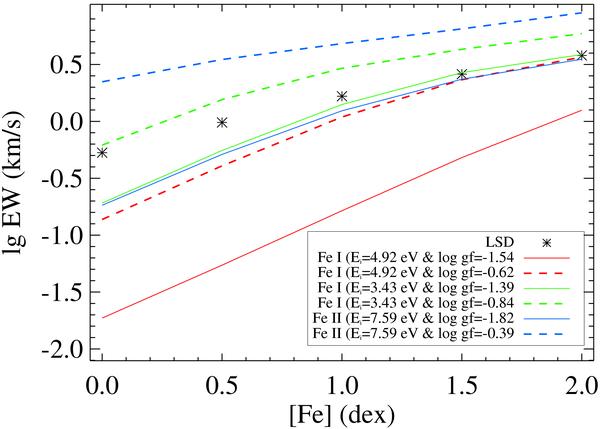
Dependence of the equivalent width on abundance for the LSD profiles (symbols) and theoretical profiles of Fe spectral lines (lines). Different lines illustrate the EW-abundance dependence obtained for different combinations of line parameters. Red: averaging over all Fe lines; green: averaging over Fe i lines; blue: averaging over Fe ii lines. The dashed and solid lines show results for the oscillator strength determined using harmonic and arithmetic averaging, respectively.
Current usage metrics show cumulative count of Article Views (full-text article views including HTML views, PDF and ePub downloads, according to the available data) and Abstracts Views on Vision4Press platform.
Data correspond to usage on the plateform after 2015. The current usage metrics is available 48-96 hours after online publication and is updated daily on week days.
Initial download of the metrics may take a while.